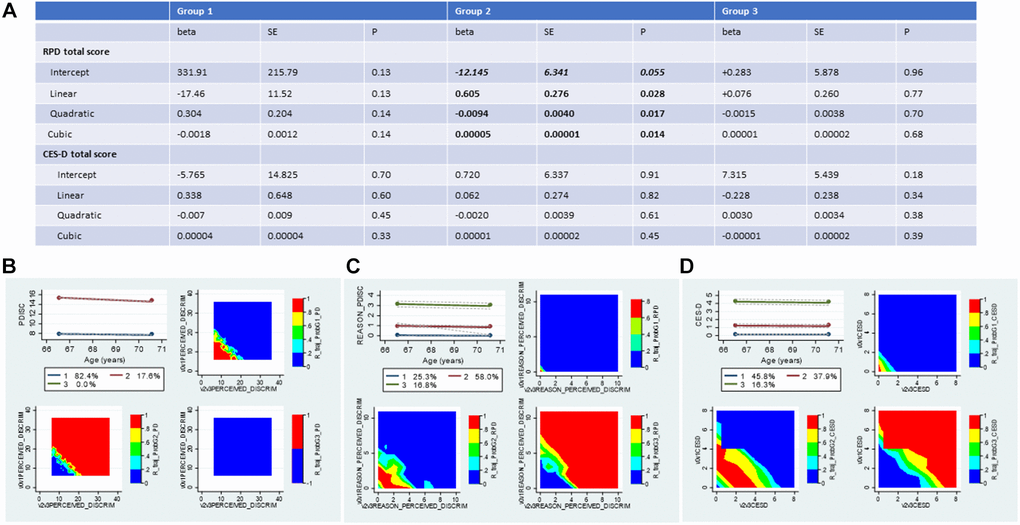
Figure 2.Trajectories in perceived discrimination and depressive symptoms measures 2010-2016: Group-based trajectory models; HRS 2010-2016 (N = 2,806). (A) Results of the Group-based trajectory model for RPD and CES-D score; (B) Trajectory plot for EOD and contour plots for raw values at each combined visit per group; (C) Trajectory plot for RPD and contour plots for raw values at each combined visit per group; (D) Trajectory plot for CES-D and contour plots for raw values at each combined visit per group. Abbreviations: EOD: Experience of Discrimination; HRS: Health and Retirement Study; RPD: Reasons for perceived discrimination; PDISC: same as EOD and PERCEIVED_DISCRIM; REASON_PDISC: same as RPD and REASON_PERCEIVED_DISCRIM; v0: baseline visit, wave 10 (2010); v1: first follow-up visit, wave 11 (2012); v2: second follow-up visit, wave 12 (2014); v3: third follow-up visit, wave 13 (2016); v0v1: combined visits 0 and 1; v2v3: combined visits 2 and 3. Note: v0v1AGE was mainly v1AGE unless v1AGE was missing, then it was imputed with v0AGE. Similarly, v2v3AGE was mainly v3AGE unless v3AGE was missing, then it was imputed with v2AGE. The same applied to the CES-D scores, whereby v0v1CESD was mainly v1CESD, and v2v3CESD was mainly v3CESD. EOD for combined v0v1 was half in v0 and the other half in v1, and similarly for RPD, given that they were measured in half samples. The Table is based on zero-inflated Poisson GBTM models. Predicted values for each score at each age, require exponentiation of the linear combinations.