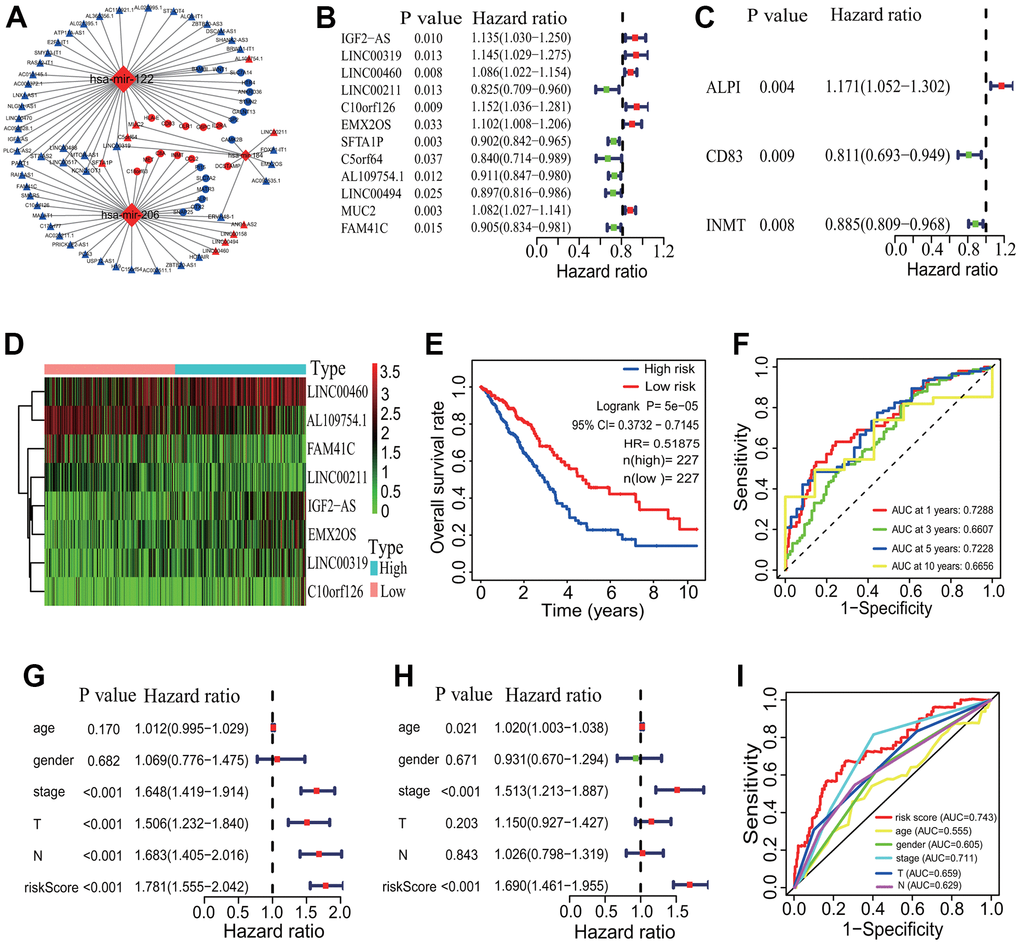
Figure 8.CeRNA network and prognostic signature construction. (A) CeRNA network. A ceRNA network with 26 DEmRNAs, 3 DEmiRNAs and 57 DElncRNAs was established. (B) Univariate Cox regression analysis based on 57 DElncRNAs. Twelve DElncRNAs were identified to have significant associations with the OS of LUAD patients. (C) Univariate Cox regression analysis based on 26 DEmRNAs. Three DEmRNAs were identified to have significant associations with the OS of LUAD patients. (D) Gene expression profiles of 8 DElncRNAs. Five DElncRNAs and 3 DElncRNAs were separately highly and lowly expressed in the high-risk group. (E) Survival curve. The patients in the low-risk group exhibited a better overall survival rate than those in the high-risk group (p=5e-05, HR=0.51875, 95% CI=0.3732-0.7145). (F) ROC curve correlated with survival. The AUCs of 1-, 3-, 5- and 10-years of the 8-lncRNA prognostic model were separately 0.7288, 0.6607, 0.7228 and 0.6656. (G, H) Independent prognostic analysis. The 8-lncRNA risk signature was significantly correlated with the OS of LUAD patients by a univariate and a multivariate Cox regression analysis. (I) ROC curve correlated with independent prognostic signature. The AUCs of risk score independently predicting survival was 0.743. CeRNA, competitive endogenous RNA; DElncRNA, differentially expressed lncRNA; DEmRNA, differentially expressed mRNA; DEmiRNA, differentially expressed miRNA; LUAD, lung adenocarcinoma; ROC, receiver operating characteristic; AUC, area under the curve; OS, overall survival.