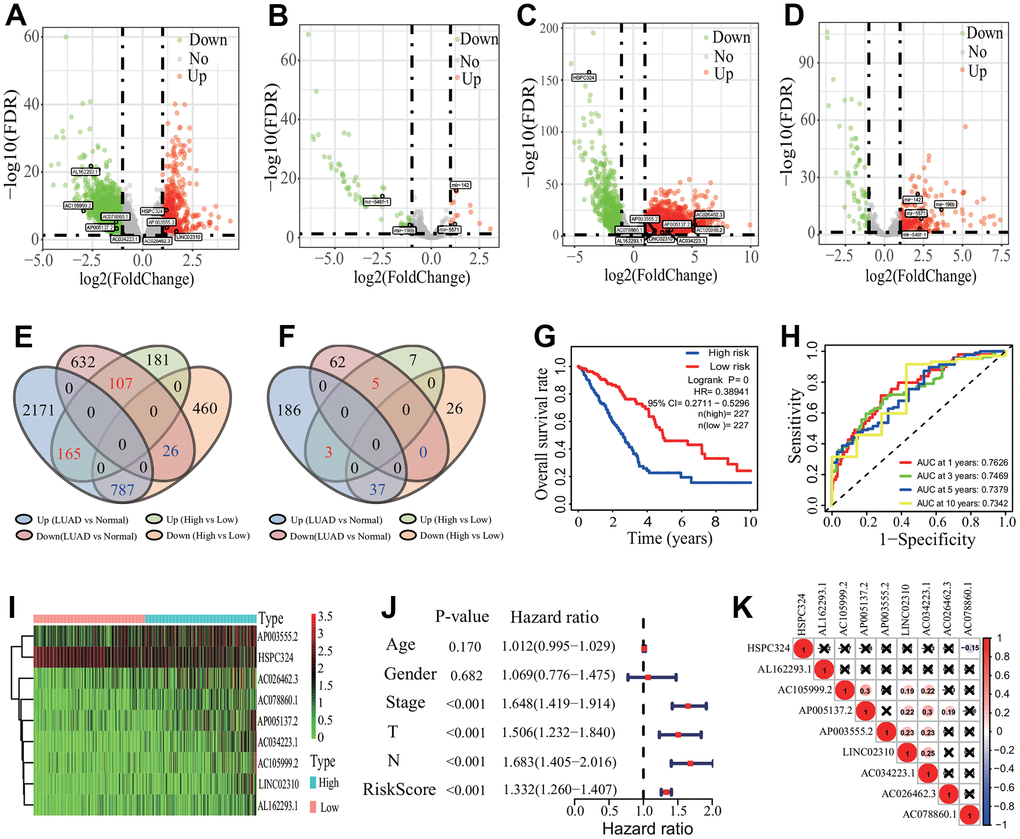
Figure 7.Differentially expressed lncRNAs and miRNA identification and prognostic signature construction. (A, B) Distribution of differentially expressed lncRNA and miRNA between the high and low immune infiltration groups. Totals of 1726 DElncRNAs and 78 DEmiRNAs were separately identified. (C, D) Distribution of differentially expressed lncRNA and miRNA between the LUAD and normal tissues. Totals of 3888 DElncRNAs and 293 DEmiRNAs were separately identified. (E, F) Key DElncRNA and DEmiRNA identification. Totals of 1085 key DElncRNAs and 45 key DEmiRNAs were respectively identified by an overlap analysis. (G) Survival curve. LUAD patients had a higher OS rate in the low-risk group (p=0, HR=0.38941, 95% CI=0.2711-0.5296). (H) ROC curve. The AUCs of 1-, 3, 5- and 10-years of 9-lncRNA signature were separately 0.7626, 0.7469, 0.7379 and 0.7342. (I) Heatmap of gene expression. Eight lncRNAs and one lncRNA were lowly and highly expressed in the low-risk group, respectively. (J) Independent prognostic analysis. The 9-lncRNA prognostic signature was significantly correlated with the OS of LUAD patients. (K) Expression correlation among 9 lncRNAs. The 9 lncRNAs had no significant correlations in expression. LUAD, lung adenocarcinoma; DElncRNA, differentially expressed lncRNA; DEmiRNA, differentially expressed miRNA; ROC, receiver operating characteristic; AUC, area under the curve; OS, overall survival, CI, confidence interval.