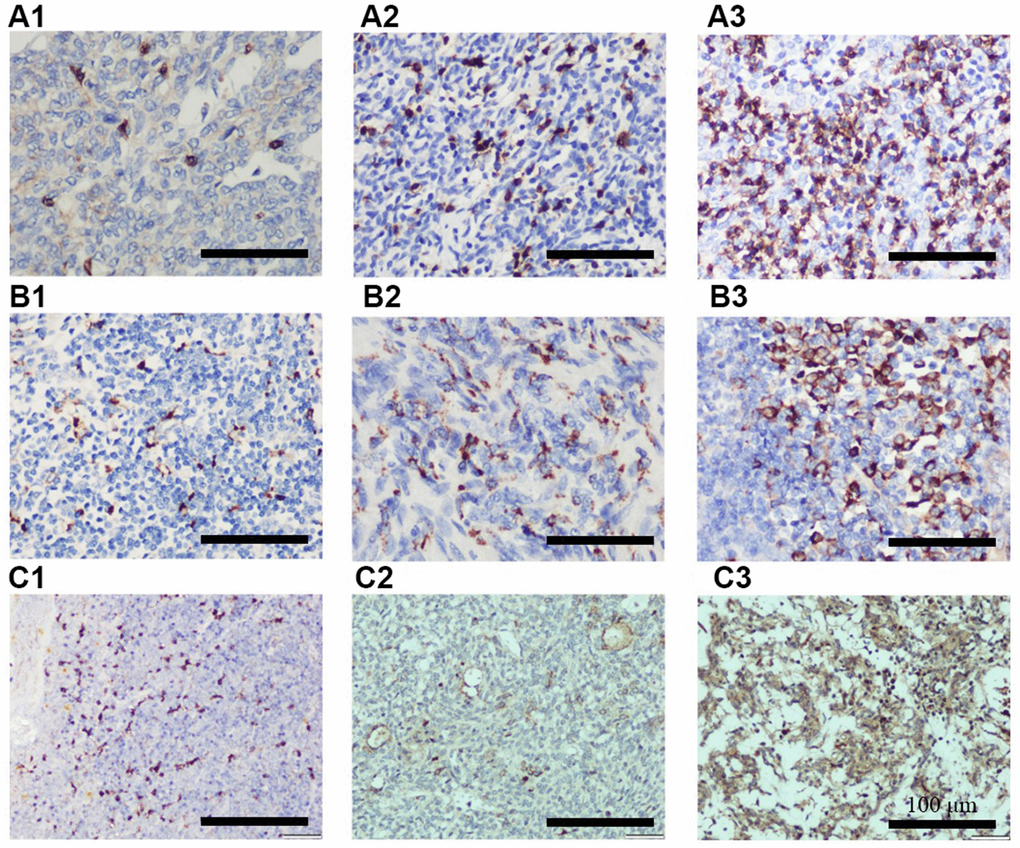
Figure 3.Representative IHC images showing different expression of CD8 (A1–A3), CD68 (B1–B3), and CCL18 (C1–C3). A1, B1, and C1 indicates + IHC score; A2, B2, and C2 indicates ++ IHC score; A3, B3, and C3 indicates +++ IHC score. (n = 3 for A–C groups; scale bars, 200 μm).