Submit an Article
Navigate
Home
Editorial Board
Editorial Policies
Current Volume
Archive
Scientific Integrity
Publication Ethics Statements
Interviews with Outstanding Authors
Newsroom
Sponsored Conferences
Podcast
Contact
Special Collections
Submit an Article
Online ISSN: 1945-4589
Research Paper
|
Volume 14, Issue 18
|
pp. 7328–7347
Establishment and validation of individualized clinical prognostic markers for LUAD patients based on autophagy-related genes
Back to article
Figure 9
(9 of 13)
−
100%
+
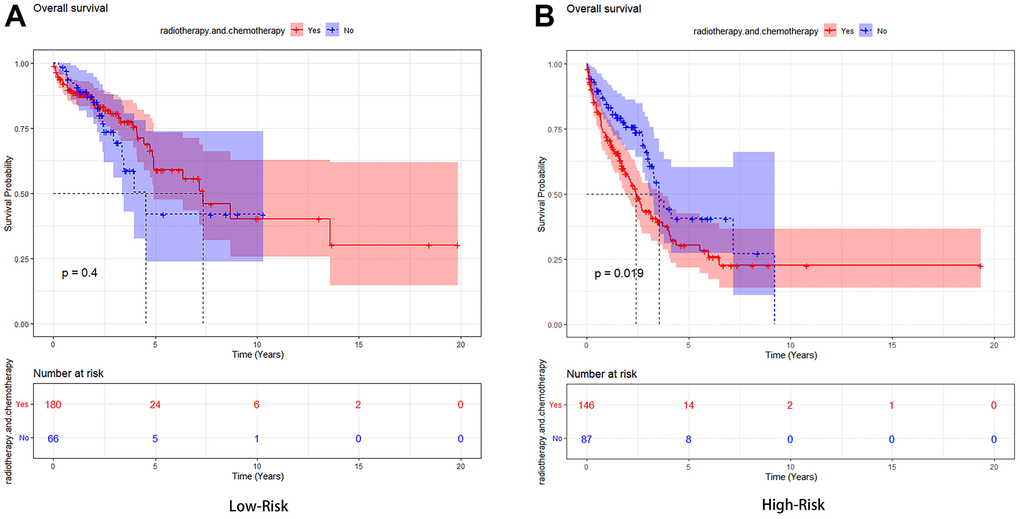
Figure 9.
Kaplan-Meier analysis of the high-risk group and low-risk group based on whether they had undergone radiotherapy and chemotherapy.
(
A
) The Low-Risk group’s Kaplan-Meier curve. (
B
) The High-Risk group’s Kaplan-Meier curve.