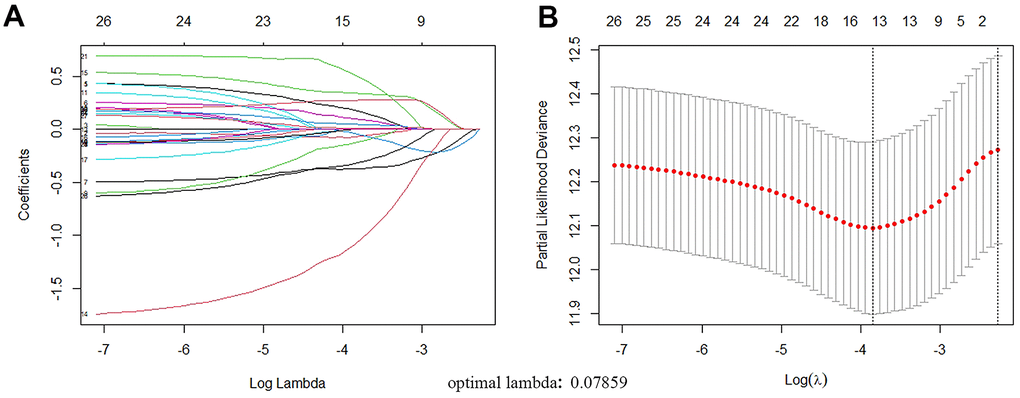
Figure 5.ARGs with prognostic potential were screened by LASSO regression. (A) Filter the optimal parameter (lambda) when drawing A vertical line. (B) The lasso coefficient distribution of 13 ARGs with non-zero coefficients was determined by the optimal lambda(0.07859).