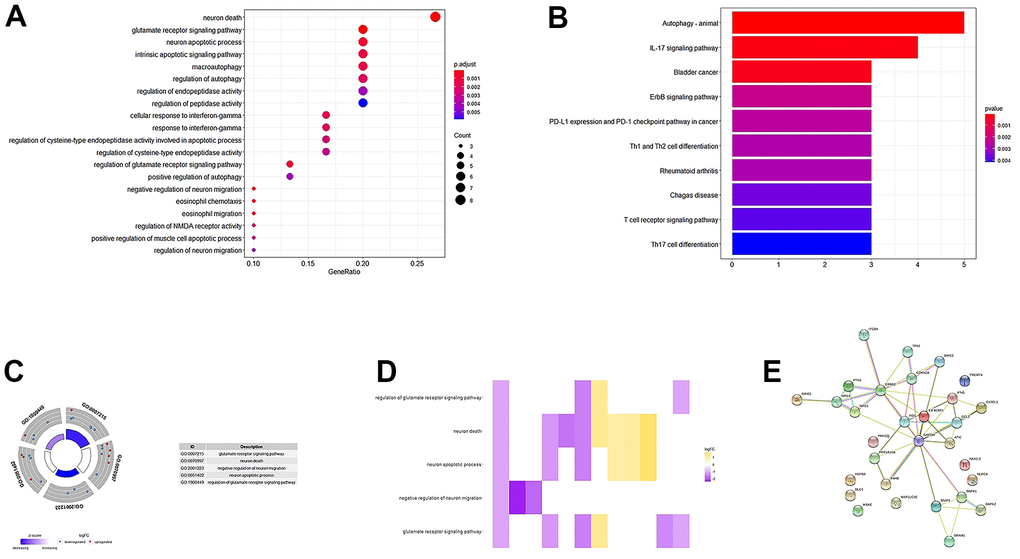
Figure 3.GO, KEGG enrichment analysis, and PPI network. (A, B) GO analysis of 31 differentially expressed autophagy-related genes. (C) A circle graph of the top five GO terms with the most gene abundance. (D) Heatmaps of the correlations between ARGs and pathways. The color of each block depends on the logFC value. (E) PPI network inner mapping of 31 autophagy-related differentially expressed genes.