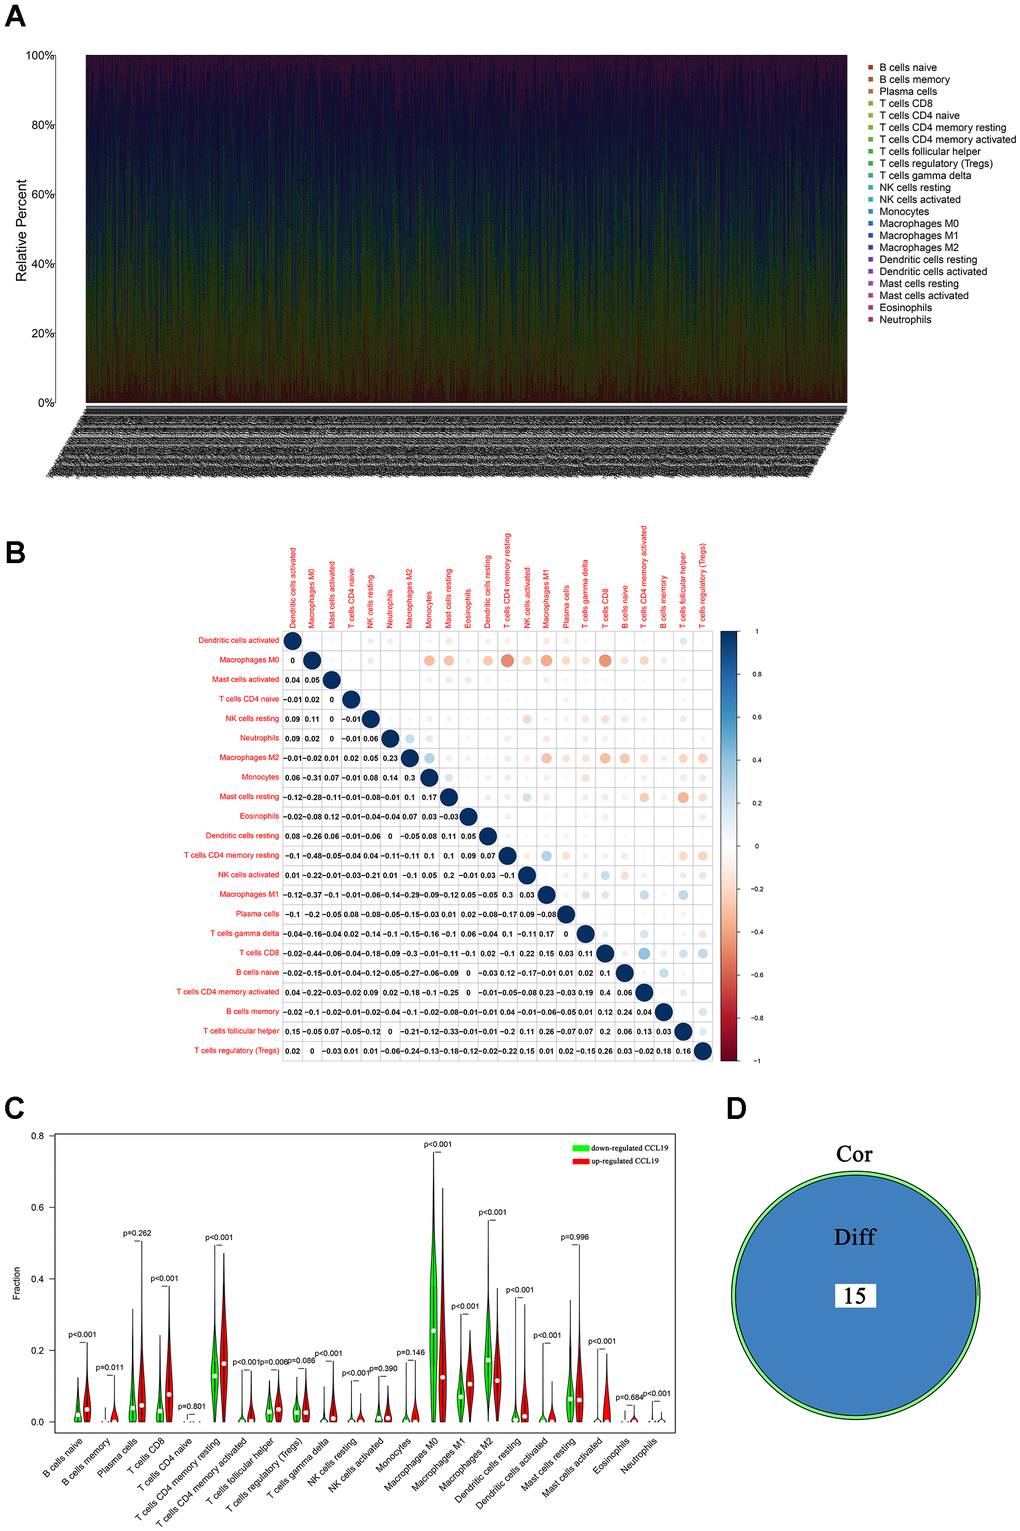
Figure 6.TIC profile and differential analysis. (A) Barplot showed the proportion of 22 TICs in breast cancer samples; (B) The diagram showed the associations between 22 TICs; each spot indicated the p value of the association between two TICs; (C) Violin plot showed the correlation between 22 TICs and the expression of CCL19; p<0.05 was considered to be statistically significant; (D) Venn plot indicated there were 15 TICs shared by the difference test and correlation test showed in violin plots (C) and scatter plots (Figure 7), respectively.
Figure 6 — CCL19 has potential to be a potential prognostic biomarker and a modulator of tumor immune microenvironment (TIME) of breast cancer: a comprehensive analysis based on TCGA database | Aging