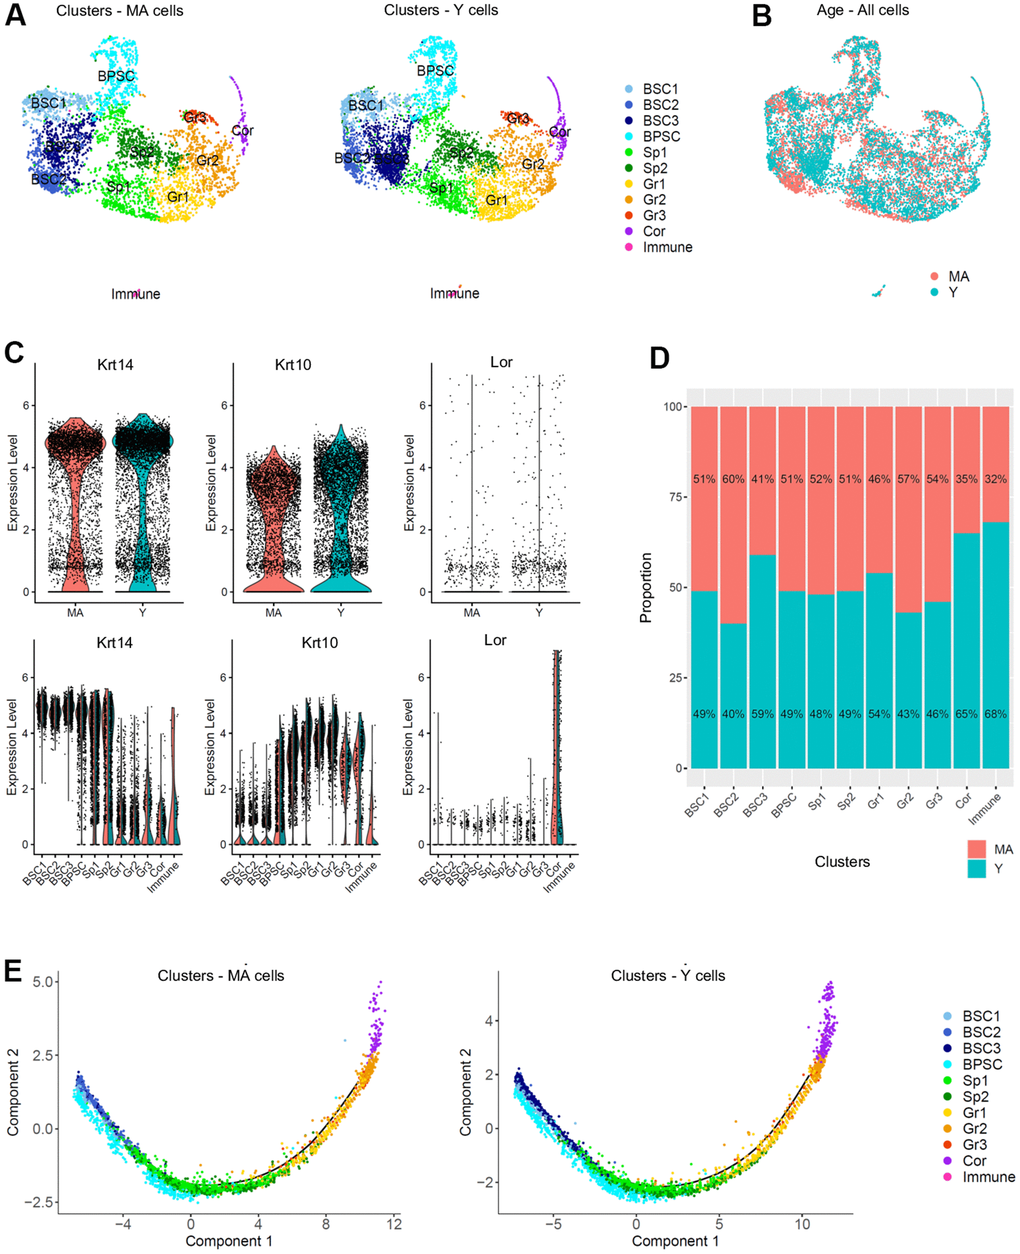
Figure 3.Single cell populations and trajectories analysis of young versus middle-aged NMR epidermal cells reveals no difference between the 2 age groups. (A) Uniform Manifold Approximation and Projection (UMAP), colored according to unsupervised clustering from middle-aged (MA; n=4,218 cells) and young (Y; n=6,014 cells) NMR epidermal cells. Cell populations from both MA and Y NMR were unchanged as the same 11 clusters were detected. (B) Cells from both MA (red) and Y (blue) NMR were jointly projected on the same UMAP plot, showing an overlap of the 2 age groups tested. (C) Violin plots of Krt14, Krt10 and Lor marker genes expressed by MA (red) and Y (blue) epidermal cells (upper panel) and segregated by cluster (lower panel). No detectable changes in their expression were found. (D) Bar graph representing the relative proportion of epidermal cells in each cluster between MA (red) and Y (blue) animals. There was no significant difference in epidermal cell proportion between the 2 age groups using Chi2 statistic test (pval ≤ 0,05). (E) Unsupervised differentiation trajectories constructed with M3Drop and Monocle v2.10.1 for MA and Y keratinocytes. Immune cells’ cluster 10 has been excluded to focus on epidermal keratinocytes. The results showed a unique trajectory with no branches in both samples and the same repartition of cluster among the trajectory. BSC = basal and stem cells; BPSC = basal proliferating and stem cells; Sp = Spinous layer cells; Gr = granular layer cells; Cor = corneous layer cells.