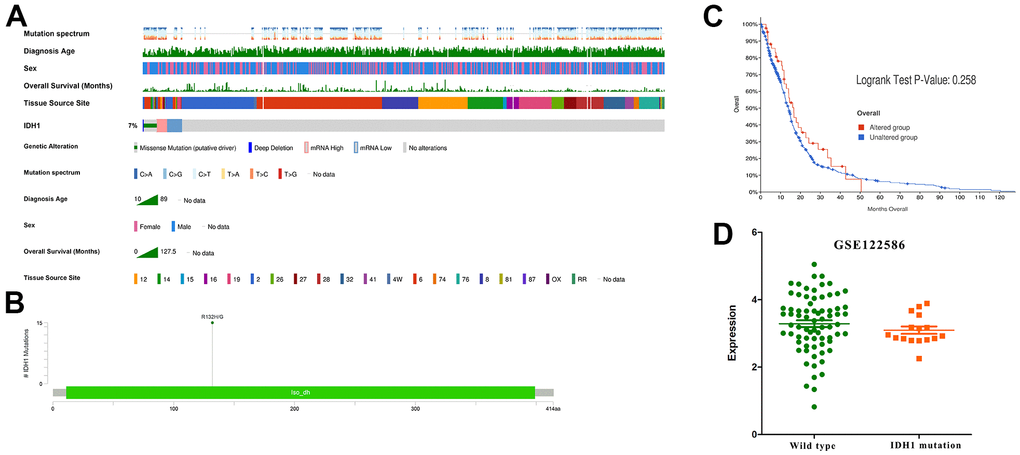
Figure 2.The IDH1 mutation in GBM. (A) Integrated view of clinical data and IDH1 aberration in GBM patients (370 samples). From top to bottom panels indicate: mutation spectrum, diagnosis age, sex, overall survival (months), tissue source site and mutation symbol of IDH1. The key to the color-coding is at the bottom. (B) The schematic diagram of IDH1 mutation site. The abscissa represents the amino acid sequence sites while the ordinate represents the number of mutant samples. (C) The survivorship curves of OV. The red curve represents samples with an IDH1 mutation and the blue one represents the wild type. (D) A scatter diagram shows the mRNA expression of IDH1 in wild type and mutated samples. The sequencing data (GSE122586) was from the GEO database.