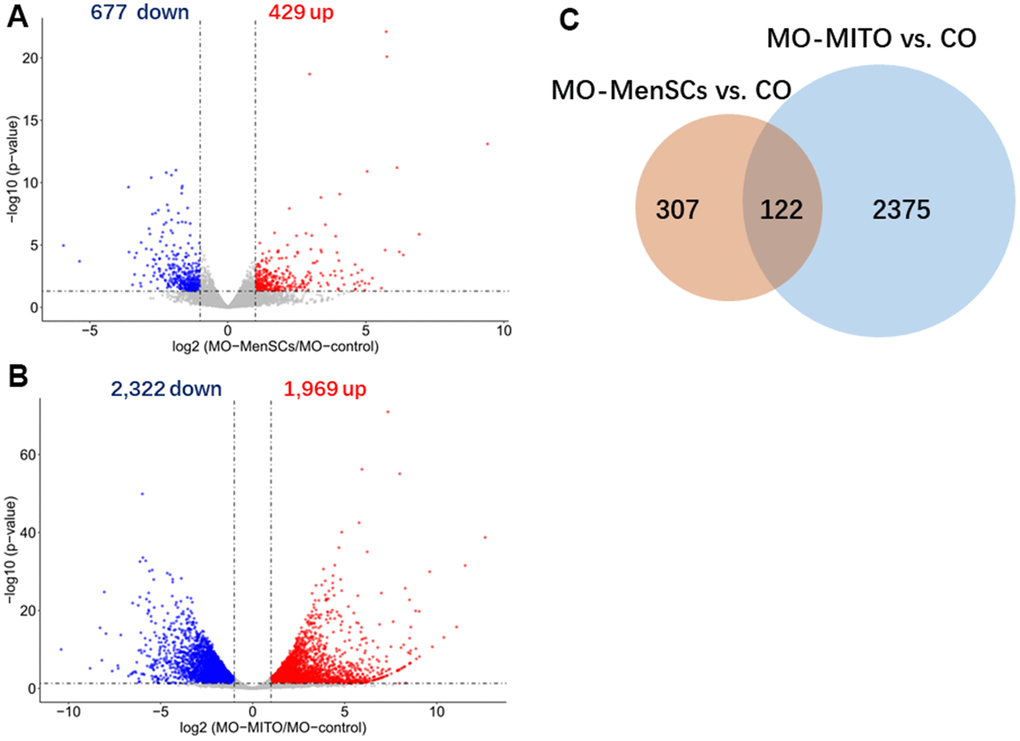
Figure 4.Identification differently expressed genes by RNA-seq analysis. Volcano plots showing differently expressed genes between MO-MenSCs vs. MO-control (A) and MO-MITO vs. MO-control (B) samples identified using transcriptomic data at day 7. Red dots denote the genes passing our p value and fold difference thresholds. The genes gene names of significant genes are marked. Venn diagram depicting the overlap of up-regulated genes between MO-MenSCs vs. MO-control and MO-MITO vs. MO-control comparisons (C).