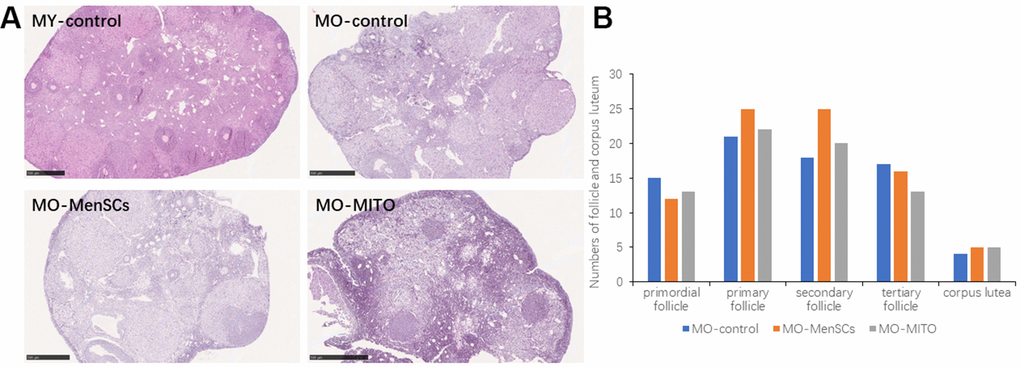
Figure 2.MO-MenSCs and MO-MITO treatment groups showed similar effects on the aged ovary. Representative images showing H&E-stained ovary sections in each group after seven days (A). Bar graph summarizing the number of growing follicles at various stages and corpus lutea in each group (B).