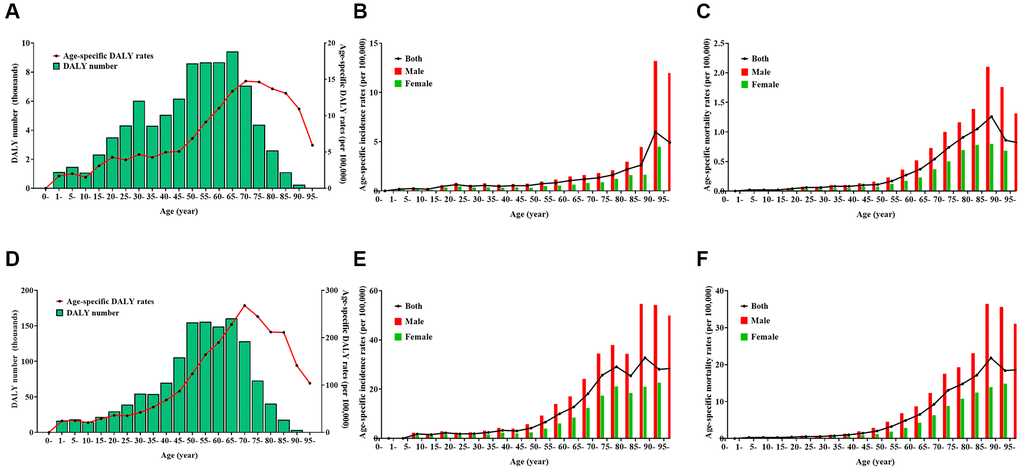
Figure 1.Burden of Hodgkin lymphoma (HL) and non-Hodgkin lymphoma (NHL) by age and sex in 2019. (A) number and age-standardized rates of disability-adjusted life years for HL, (B) age-standardized incidence rates for HL, (C) age-standardized mortality rates for HL, (D) number and age-standardized rates of disability-adjusted life years for NHL, (E) age-standardized incidence rates for NHL, (F) age-standardized mortality rates for NHL.