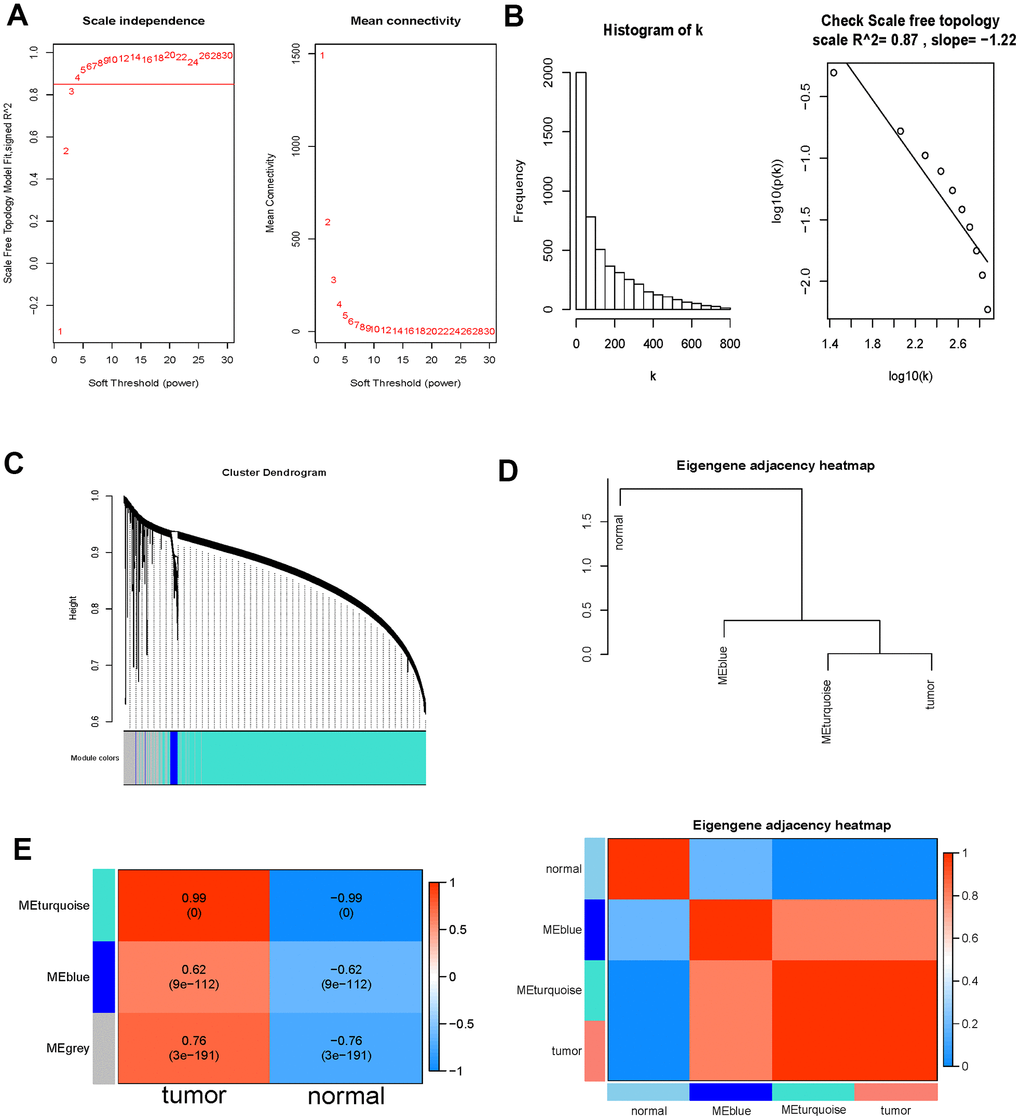
Figure 3.WGCNA analysis outcome. (A) Soft threshold filtering. The left diagram showed the relationship between the filtering threshold R^2 and the soft-thresholding power. The horizontal solid line indicated the screening threshold R2>0.85. And the right diagram showed the association between the mean connectivity and the soft-thresholding power. (B) Detection of the soft threshold of the network. The sloping solid line represented the fitted curve. There was a negative correlation between K and p(k) (correlation coefficient 0.87), indicating that the selected power value could establish a scale-free network. (C) Cluster dendrogram of the DE-immlncRNAs. Each branch on the upper side of the figure represented a lncRNA; On the bottom side of the figure, the attribution of lncRNA was marked corresponding to that on the top side, and each color represented a module. (D) Phenotypic dependent inter-module cluster diagram to visualize the relationships between different modules and phenotypes. (E) Heat map of correlation between the immlncRNA module and clinical phenotype. The value of the correlation coefficient decreased continuously from red to blue, and the redder zones indicated stronger positive correlation while the bluer zones indicated stronger negative correlation.