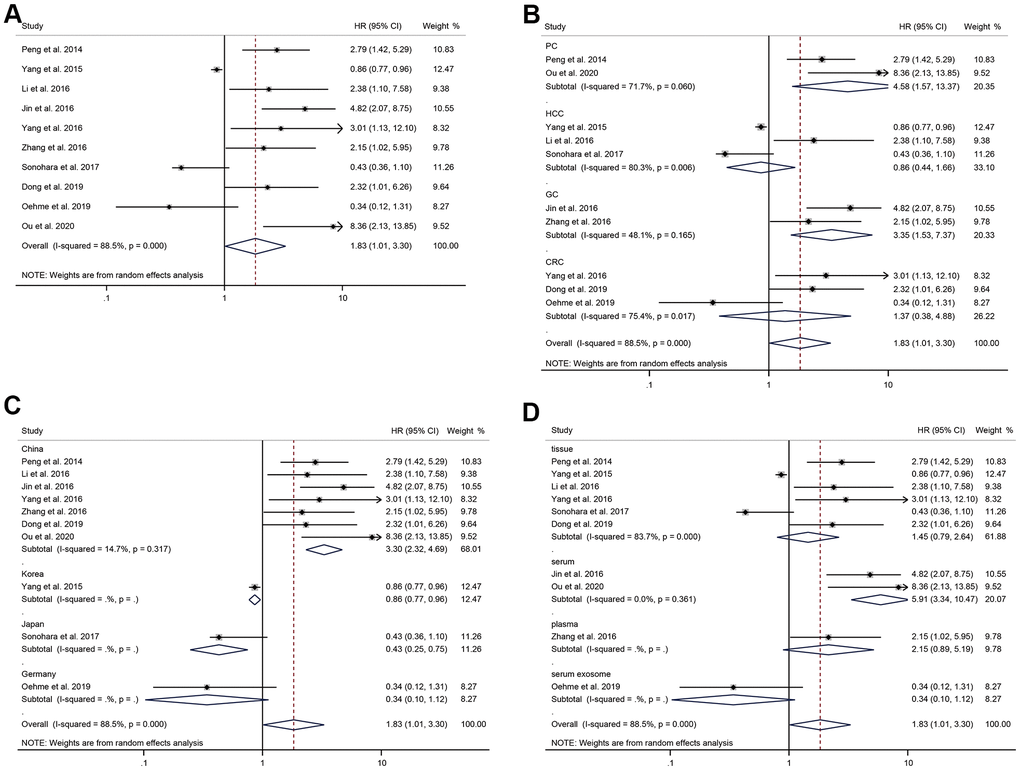
Figure 2.The correlation analysis between HULC expression level and OS. (A) Forest plot of the correlation between HULC expression level and OS in patients with digestive system tumors. (B) Subgroup analysis of HRs of OS according to the cancer type. (C) Subgroup analysis of HRs of OS according to the regions. (D) Subgroup analysis of HRs of OS according to the specimens.