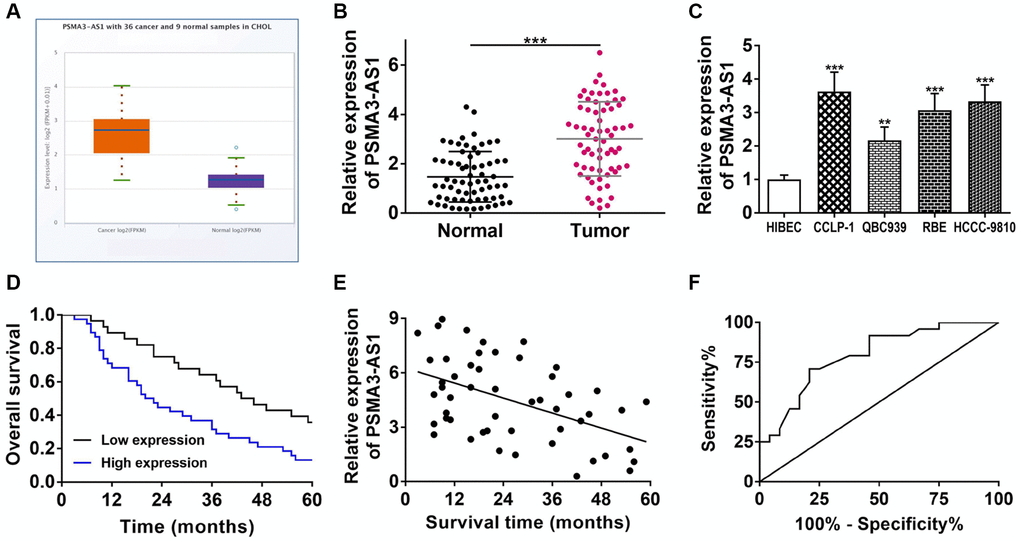
Figure 1.PSMA3-AS1 expression and its association with clinicopathological characteristics. (A) PSMA3-AS1 expression in TCGA database. (B) PSMA3-AS1 expression in CCA tissues and paired adjacent tumor-free bile duct tissues. (C) PSMA3-AS1 expression in CCA cells. (D) Kaplan-Meier curves analyzed the survival correlation. (E) Pearson correlation analysis examined the linear correlation of PSMA3-AS1 expression and survival time. (F) ROC curve assessed the potential of PSMA3-AS1 as a prognostic marker. **P < 0.01, ***P < 0.001.