Submit an Article
Navigate
Home
Editorial Board
Editorial Policies
Current Volume
Archive
Scientific Integrity
Publication Ethics Statements
Interviews with Outstanding Authors
Newsroom
Sponsored Conferences
Podcast
Contact
Special Collections
Submit an Article
Online ISSN: 1945-4589
Research Paper
|
Volume 14, Issue 1
|
pp. 389–409
Chordin-like 1 is a novel prognostic biomarker and correlative with immune cell infiltration in lung adenocarcinoma
Back to article
Figure 3
(3 of 8)
−
100%
+
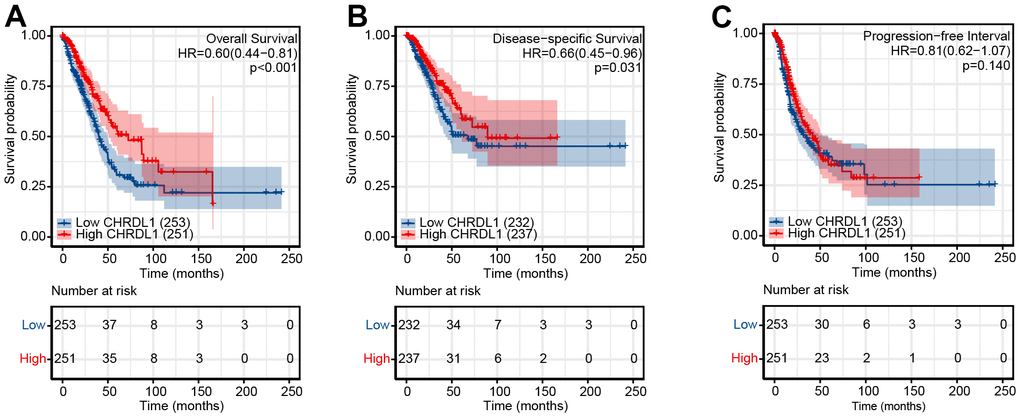
Figure 3.
Impact of CHRDL1 expression on OS (
A
), DSS (
B
) and DFS (
C
) in patients with LUAD in a TCGA cohort. The bottom half of the picture showed that the risk table records the number of people who were still following at each point in time.