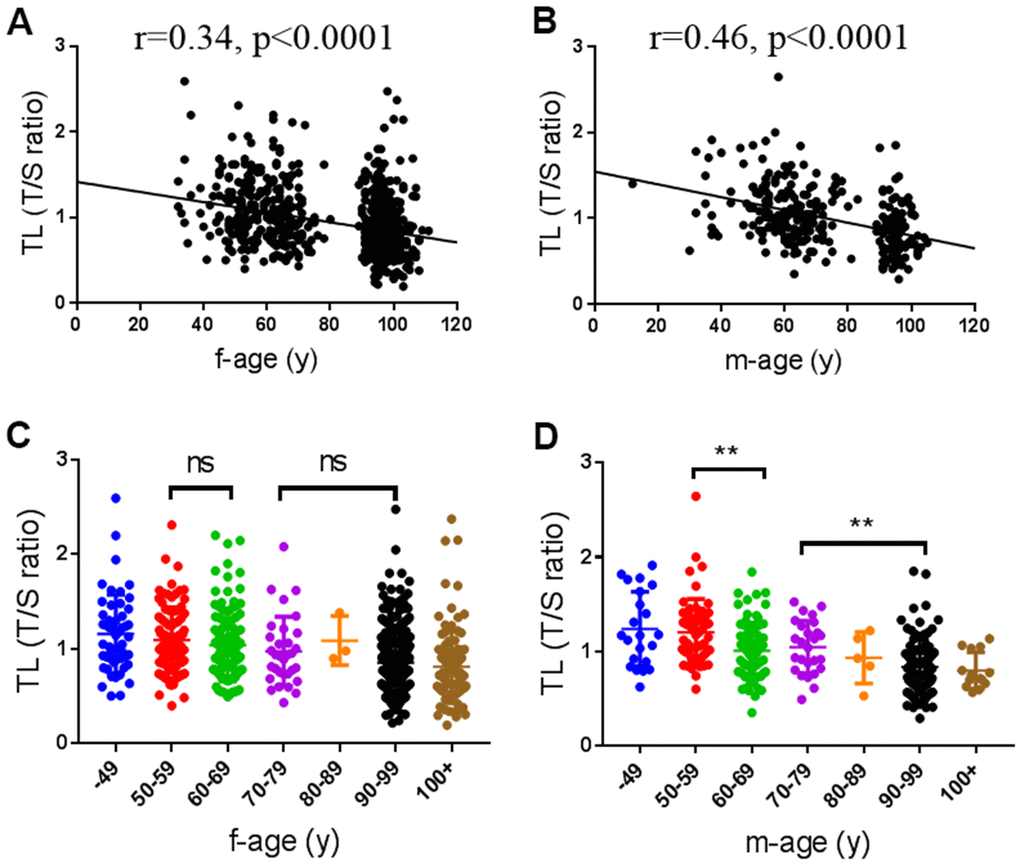
Figure 1.Associations of telomere length (TL) with age. (A, B) Scatter plot of TL with age in female (n=720) and male subjects (n=289), respectively. (C, D) The distribution of TL in female and male at different age groups. f, female; m, male.
Figure 1 — Telomere length is maternally inherited and associated with lipid metabolism in Chinese population | Aging