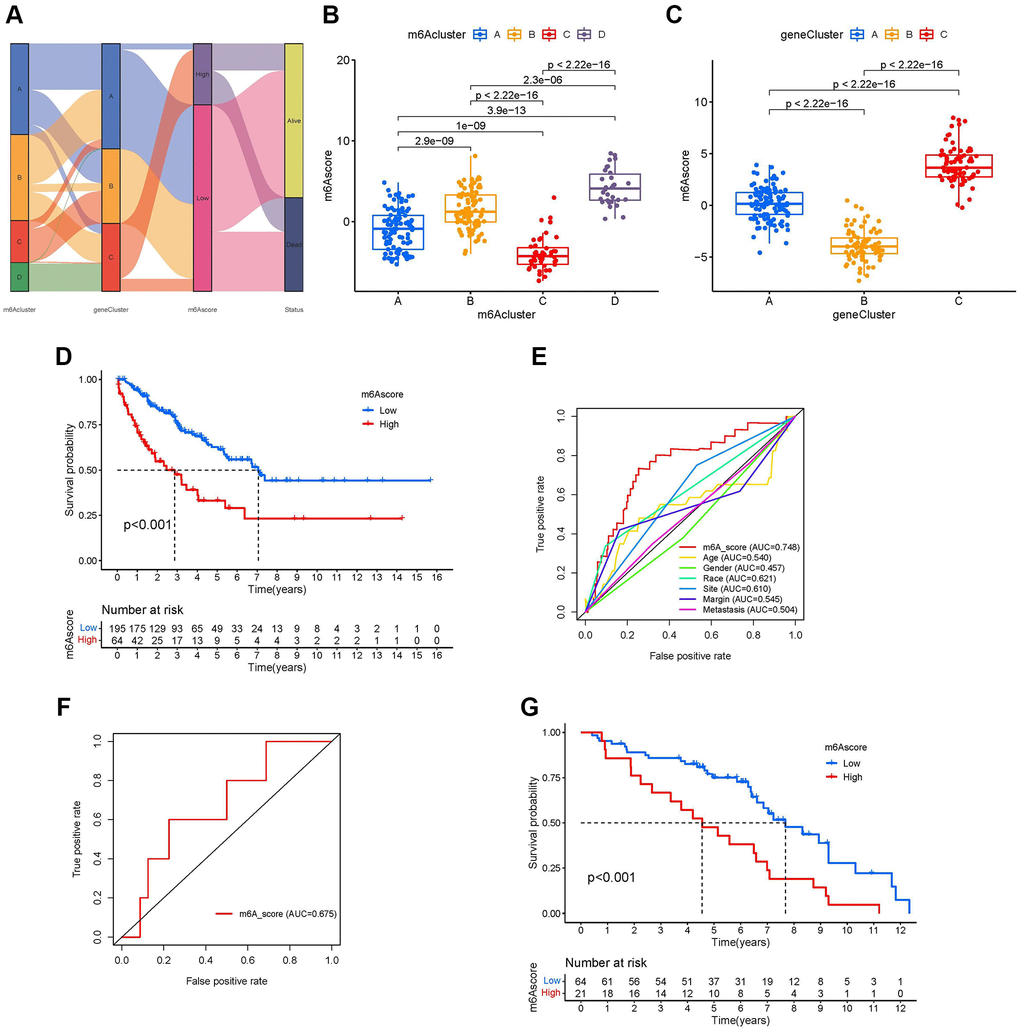
Figure 6.Development of the m6A score and exploration of m6A-related clinical features. (A) Sankey diagrams of different m6A modification clusters, m6A gene clusters, m6A scores, and different prognosis status. (B) Differences in the m6A scores among four m6A modification clusters (P-value <0.001, Kruskal-Wallis test). (C) Differences in the m6A scores among three m6A gene clusters (P-value <0.001, Kruskal-Wallis test). (D) Survival analyses for low-and high-m6A score groups using Kaplan-Meier curves (P-value < 0.001, Log-rank test). (E) Comparison of the area under the receiver operating characteristic curve between the m6A score and clinicopathological characteristics. (F) The receiver operating characteristic curve of m6A score in the validation set GSE63157 (Area under curve = 0.675). (G) Survival analyses for low- and high-m6A score groups using Kaplan-Meier curves in validation set GSE63157 (P-value < 0.001, Log-rank test).