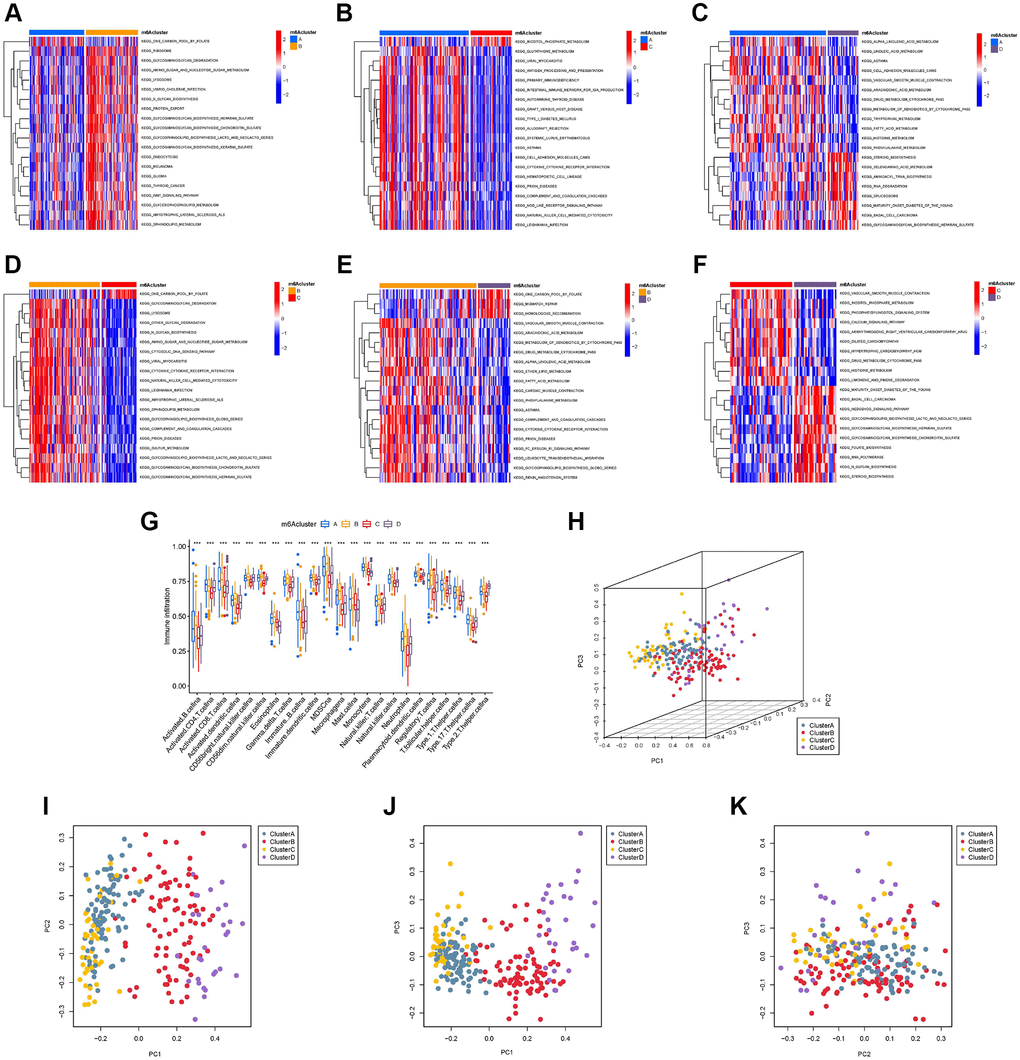
Figure 4.Gene set variation analysis (GSVA), single sample gene set enrichment analysis, and principal component analysis (PCA). The heat map shows the GSVA scores of representative hallmark passages by comparing two by two m6A regulator expression patterns. (A) m6A cluster-A vs. m6A cluster-B; (B) m6A cluster-A vs. m6A cluster-C; (C) m6A cluster-A vs. m6A cluster-D; (D) m6A cluster-B vs. m6A cluster-C; (E) m6A cluster-B vs. m6A cluster-D; (F) m6A cluster-C vs. m6A cluster-D; (G) Abundance of infiltrating cells in each of the four m6A modification patterns. Asterisks represent the statistical P-values (*P < 0.05; **P < 0.01; ***P < 0.001). (H) Three-dimensional PCA (3D PCA) results of four m6A modification clusters, showing significant differences in the transcriptome between different modification clusters. (I) Projection of 3D PCA on the first principal component (PC1) and the second principal component (PC2). (J) Projection of 3D PCA on PC1 and the third principal component (PC3). (K) Projection of 3D PCA on PC2 and PC3.