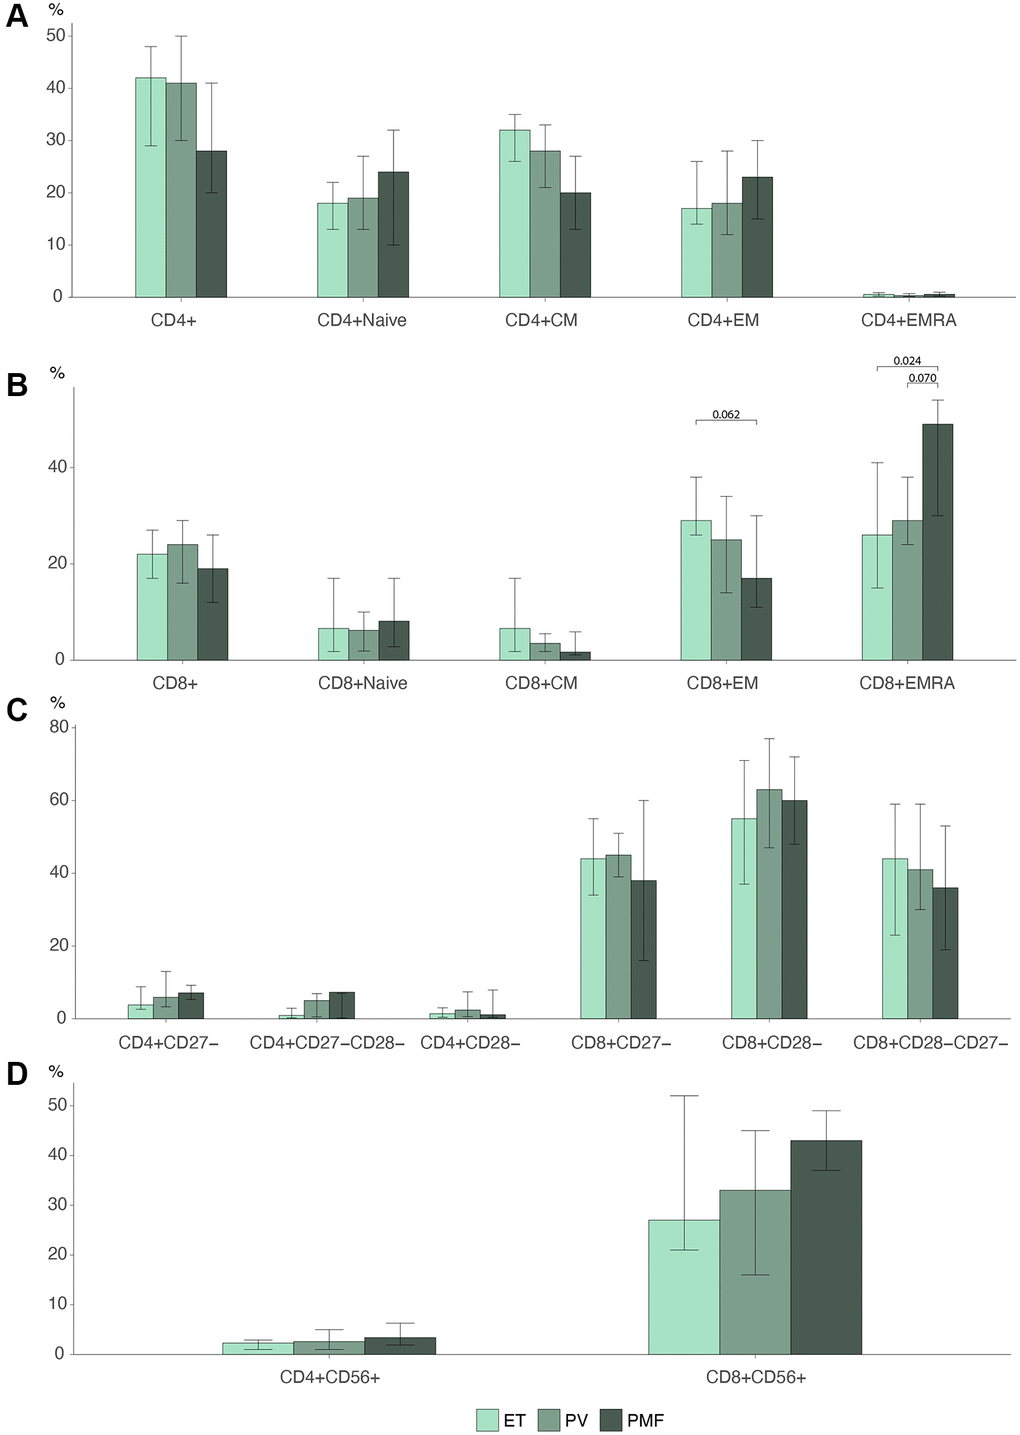
Figure 3.Barplots MPN subtypes of (A) CD4 T cell differentiation profile (B) CD8 T cell differentiation profile. (C) Loss of costimulatory markers in CD4 and CD8 T cells. (D) CD56 expression in CD4 and CD8 cells Statistically significant p-values are shown above bar plots. Statistical comparisons between groups: Kruskal Wallis test or robust linear regression if the outcome were age-dependent and Wilcoxon rank-sum test for multiple comparisons. Abbreviations: ET: essential thrombocythemia; PV: polycythemia vera; PMF: primary myelofibrosis; Naïve: naïve T cells; CM: central memory T cells; EM: effector memory T cells; EMRA: effector memory CD45Ra+ T cells.