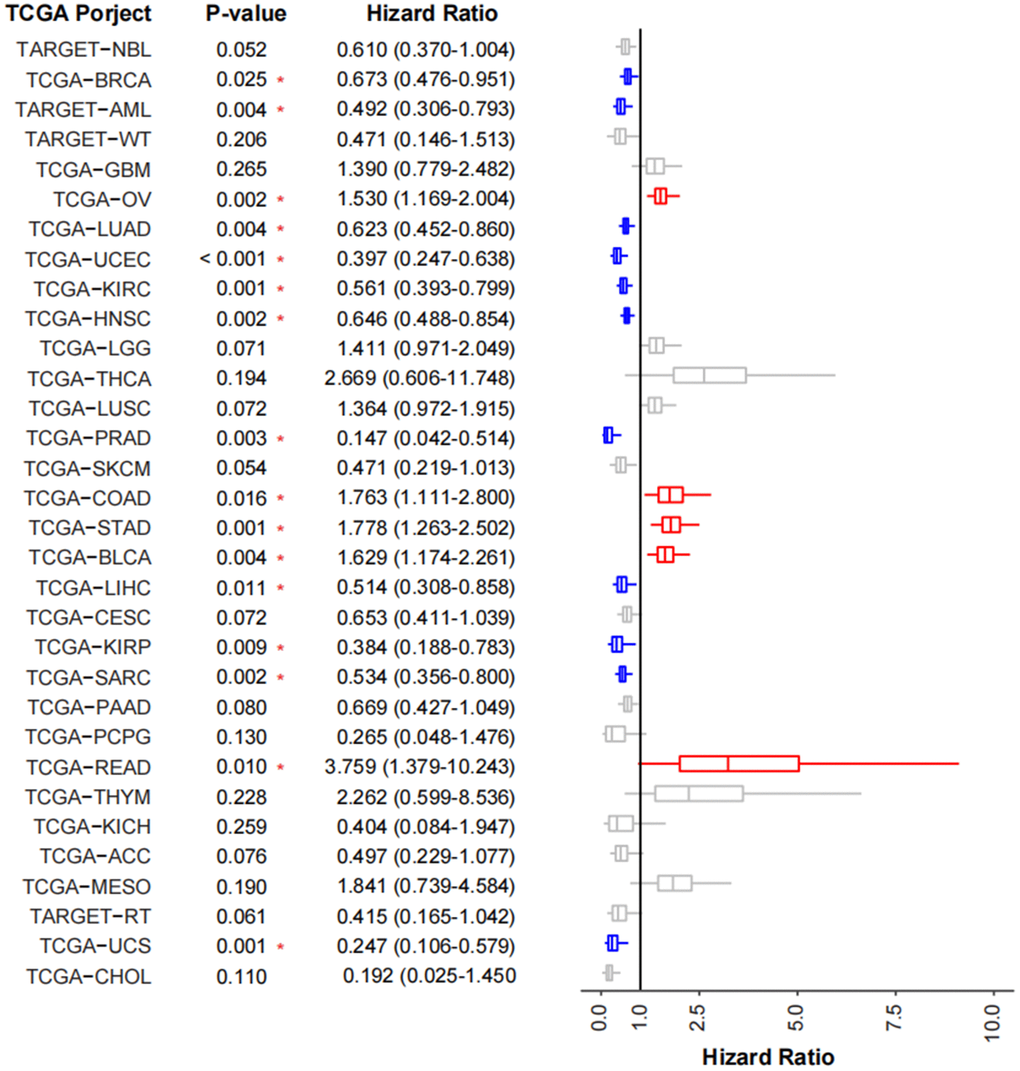
Figure 6.Validation of TMEscore on TCGA cancer cohorts. Forest plot showing the prognosis of TMEscore in 32 tumor cohorts of TCGA. The HR of tumor types marked in blue represent the prognosis of high-TMEscore group is significantly good than that in the low TMEscore group, while those marked in red are opposite.