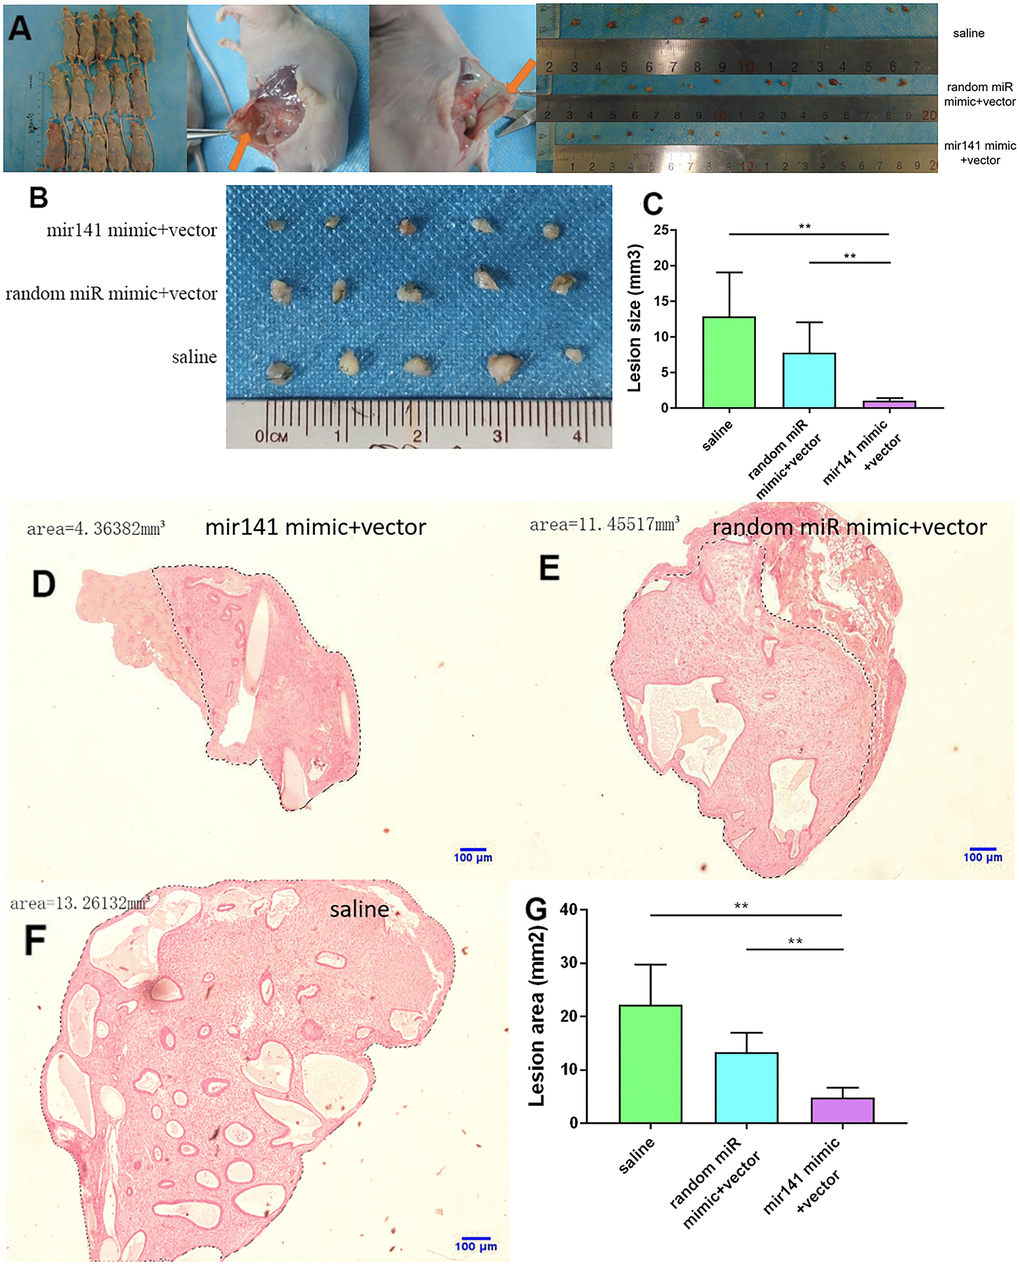
Figure 8.Collection and comparison of lesion tissues from each mouse. (A) The collection of endometriosis lesions. (B, C) Comparison of left abdominal lesion volume; (5 mice in each group). (D–G) The difference of histological area of the median section of endometriosis in mice of the upregulated group and control group under H&E staining (*P < 0.05, ** P < 0.01).