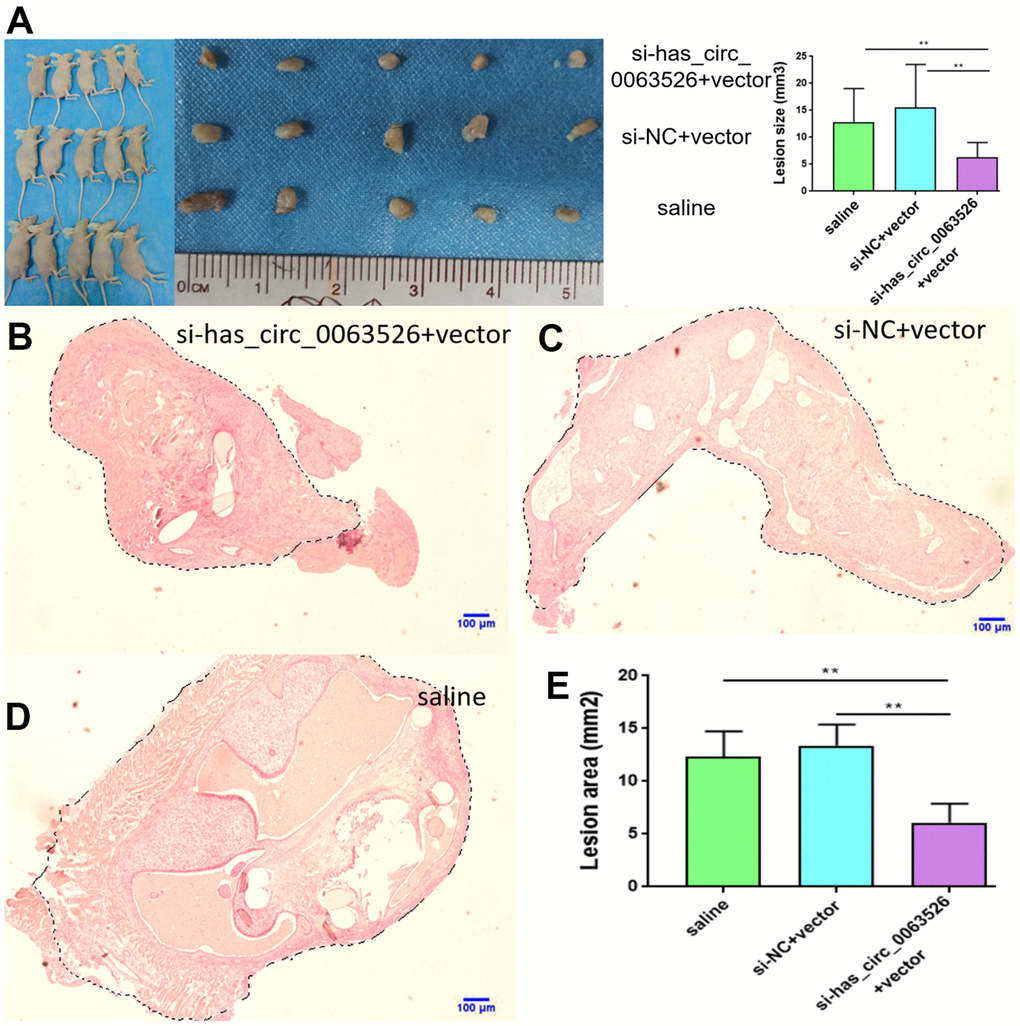
Figure 11.Tissue collection and comparison of each mouse. (A) Comparing the volume of lesions in the left abdomen; (5 mice in each group). (B–E) The difference of histological area of the median section of endometriosis in mice of the si-hsa_circ_0063526 treatment group and control group under H&E staining. Data are expressed as mean ±SEM, *P < 0.05, ** P < 0.01.