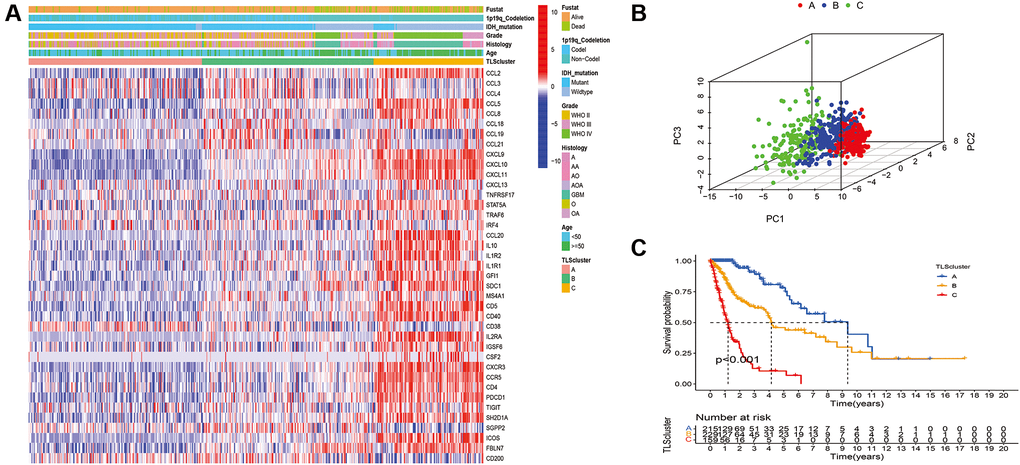
Figure 3.Identification of distinct TLS subtypes in glioma through TLS gene profiling. (A) Heatmaps of three TLS subtypes defined in TCGA cohorts and the relation between TLS subtypes and clinical features. (B) Principal component analysis (PCA) of three metabolic subtypes using candidate genes. (C) Survival analyses show significant differences between the three TLS subtypes in TCGA cohorts.