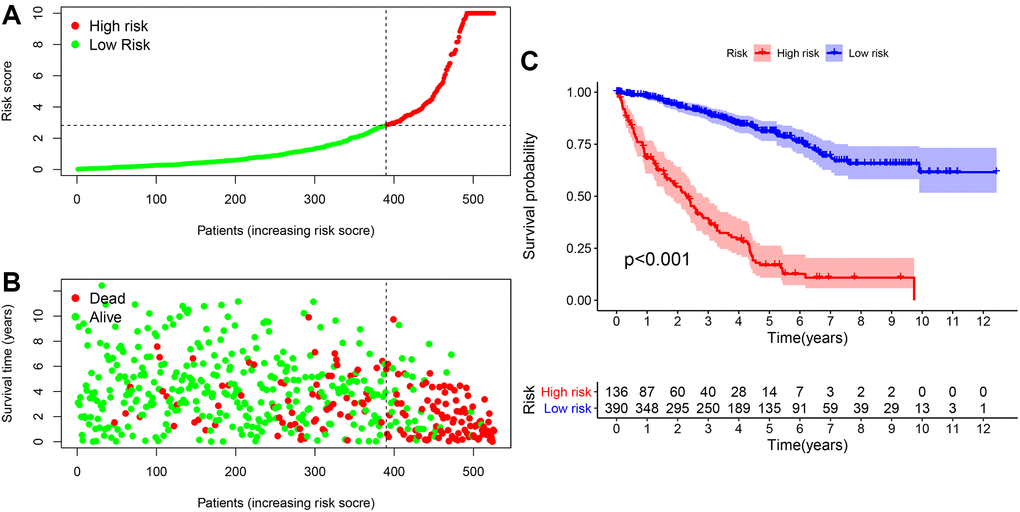
Figure 5.The risk coefficient model of ccRCC predicted outcome. (A) The risk score was divided into high- and low-risk groups. (B) Scatter plot of risk score and outcome for each patient. (C) A Kaplan-Meier curve was constructed based on the survival status of the high- and low-risk groups.