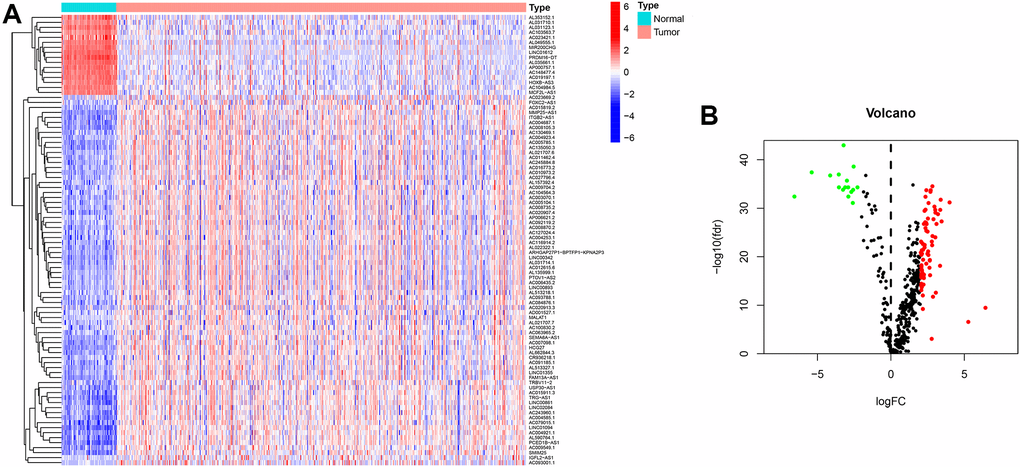
Figure 2.Heatmap and differential expression analysis of immune-related lncRNA in ccRCC. (A) Heatmap of immune-related lncRNA genes between clear cell renal cell carcinoma and normal tissues. Red indicates upregulated, and blue indicates downregulated. (B) Volcano map of immune-related lncRNA between clear cell renal cell carcinoma and normal tissues. Red dots: upregulation with significant differential expression, green dots: downregulation with significant differential expression, black dots indicate no significant difference.