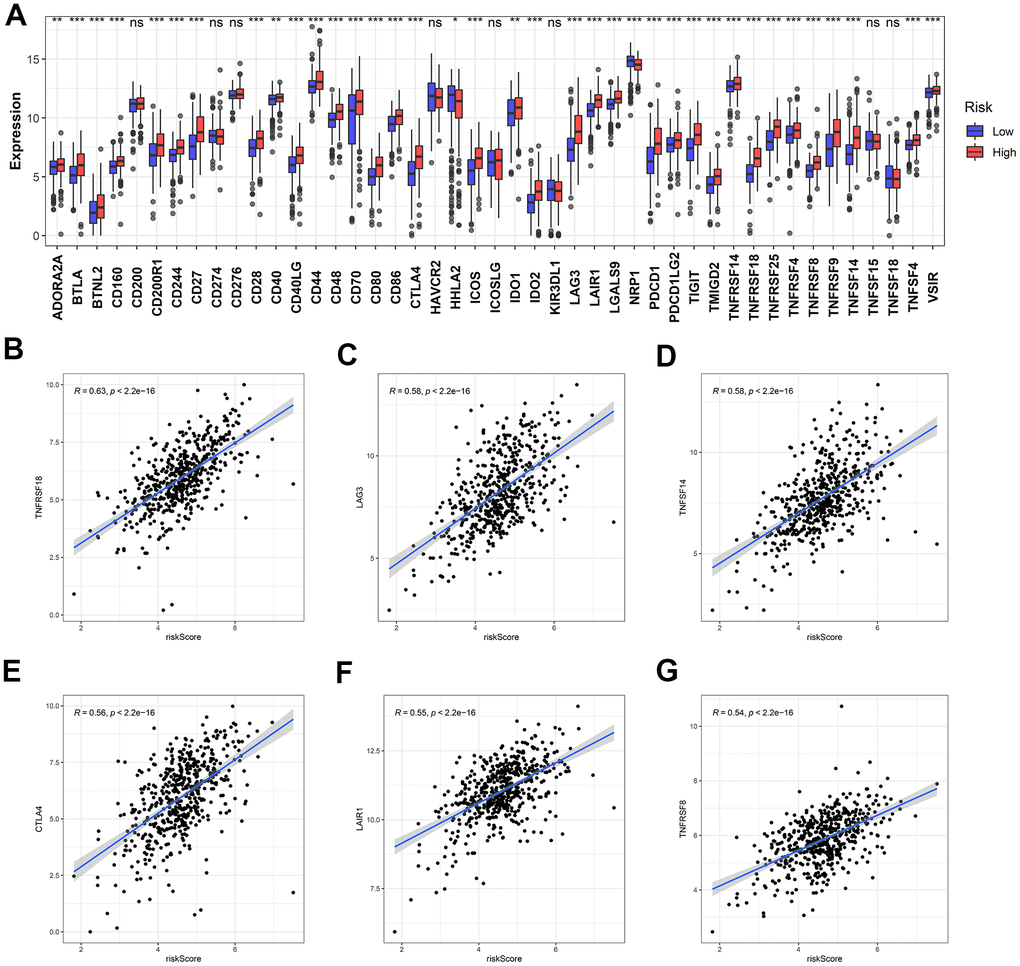
Figure 13.Identification of the correlation between the risk score and ICB-related genes. (A) The differential expression of ICB-related genes between the high- and low-risk groups. (B–G) The top six ICB-related genes with the most relevance to the risk score.