Submit an Article
Navigate
Home
Editorial Board
Editorial Policies
Current Volume
Archive
Scientific Integrity
Publication Ethics Statements
Interviews with Outstanding Authors
Newsroom
Sponsored Conferences
Podcast
Contact
Special Collections
Submit an Article
Online ISSN: 1945-4589
Research Paper
|
Volume 13, Issue 24
|
pp. 25980–26002
Identification of a competing endogenous RNA network related to immune signature in clear cell renal cell carcinoma
Back to article
Figure 1
(1 of 13)
−
100%
+
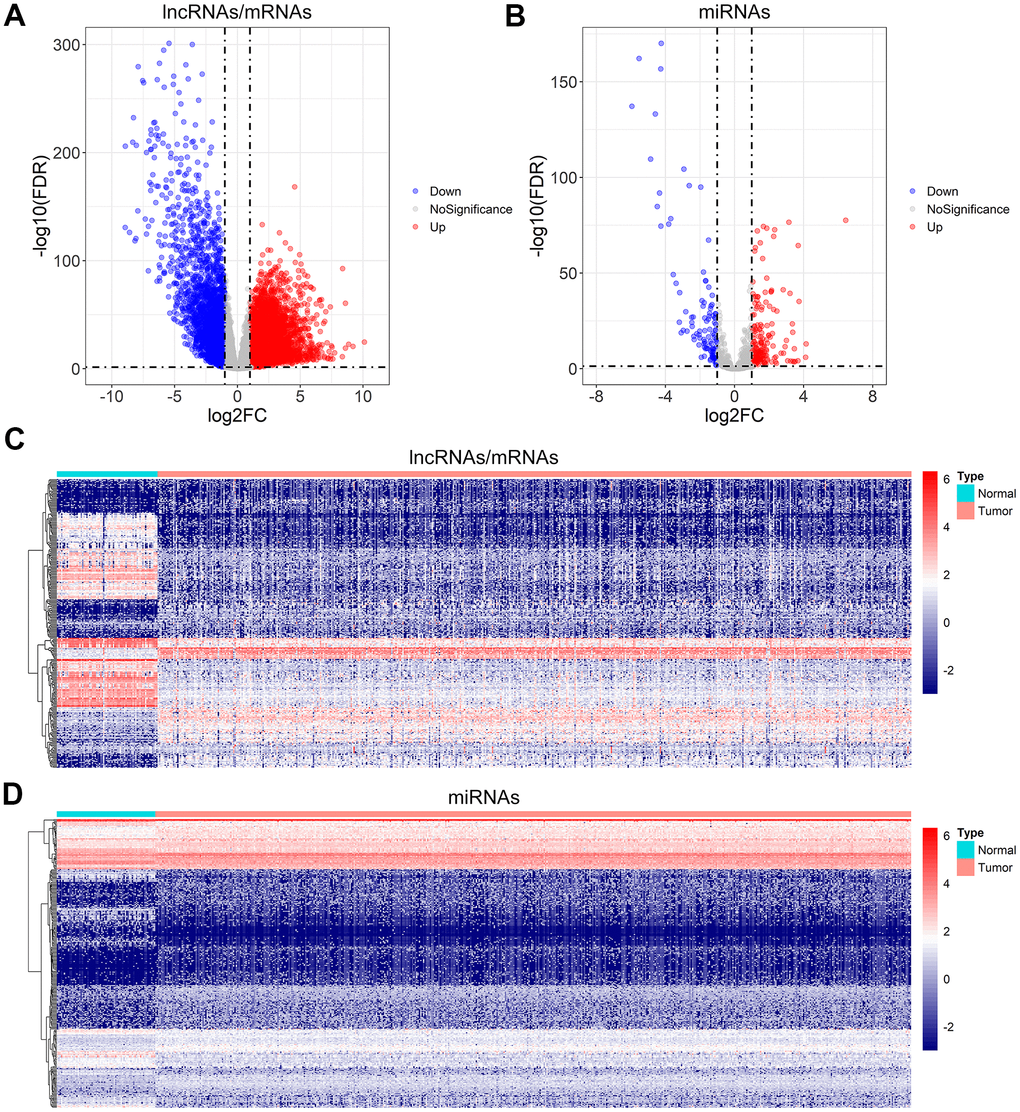
Figure 1.
Differential gene expression analysis for ccRCC.
(
A
,
B
) Volcano plot of the differentially expressed lncRNAs/mRNAs, and miRNAs. (
C
,
D
) The heatmap of the top 300 differentially expressed lncRNAs/mRNAs, and miRNAs.