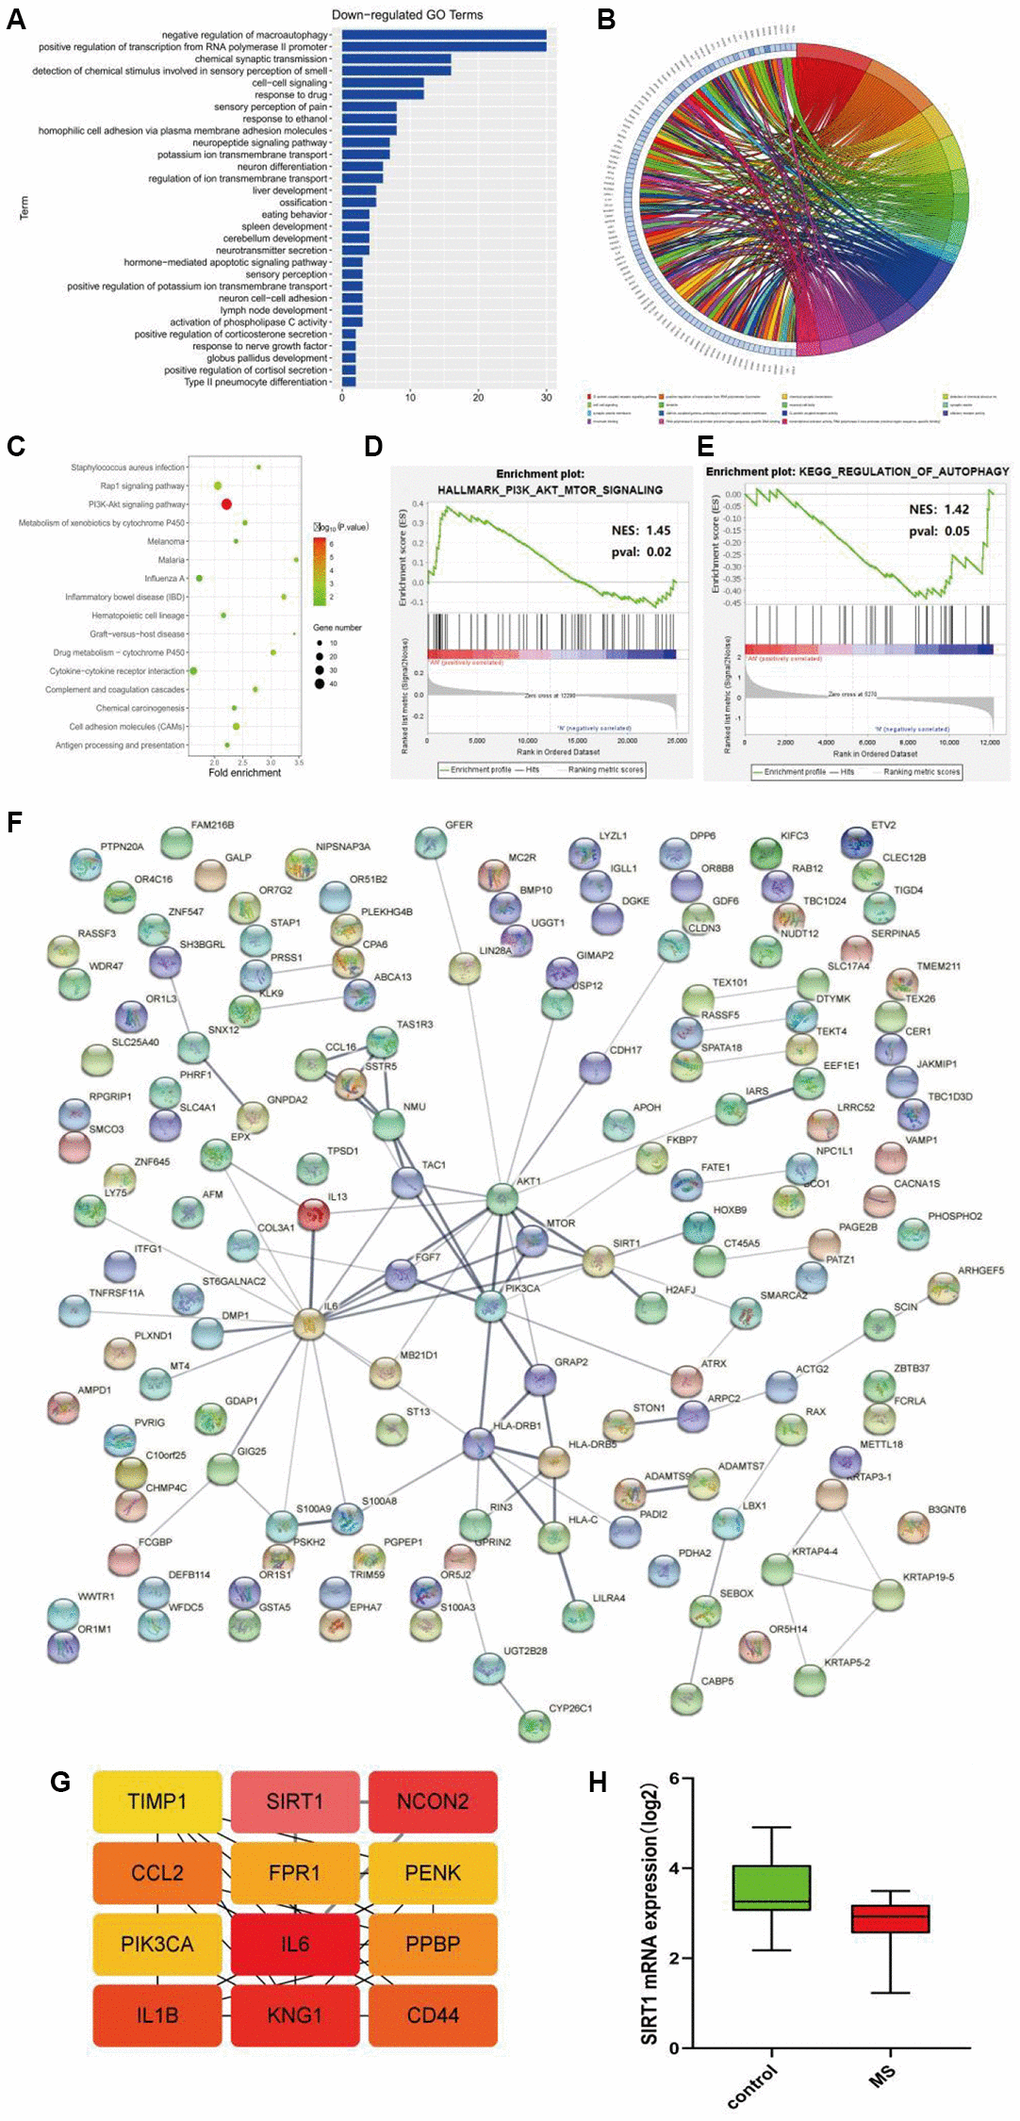
Figure 2.(A, B) GO enrichment analysis of the down-regulated pathway. (C) KEGG pathway enrichment analysis. (D, E) GSEA gene enrichment analysis. (F) The protein-protein interactive network. (G) The hub gene network. (H) The expression analysis of SIRT1.