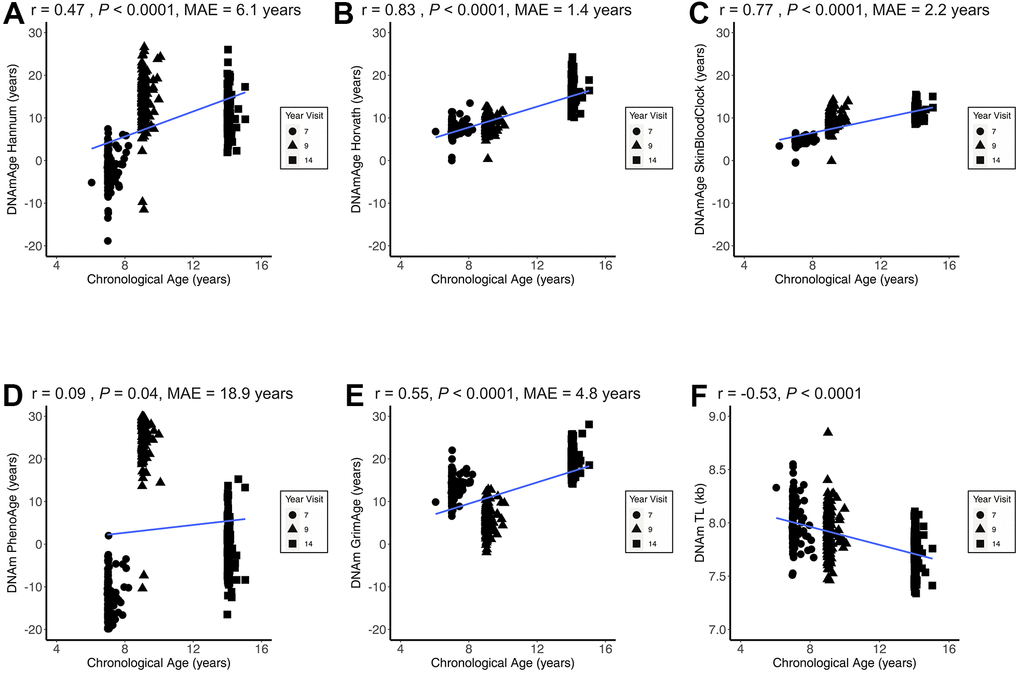
Figure 1.Epigenetic age correlations with chronological age. Figure 1 presents the child chronological age and epigenetic age correlation coefficients across all three CHAMACOS participant age timepoints (Obs = 483) for DNAmAge Hannum (A), DNAmAge Horvath (B), DNAmAge SkinBloodClock (C), DNAm PhenoAge (D), DNAm GrimAge (E), and DNAm TL (F). MAE = median absolute error.