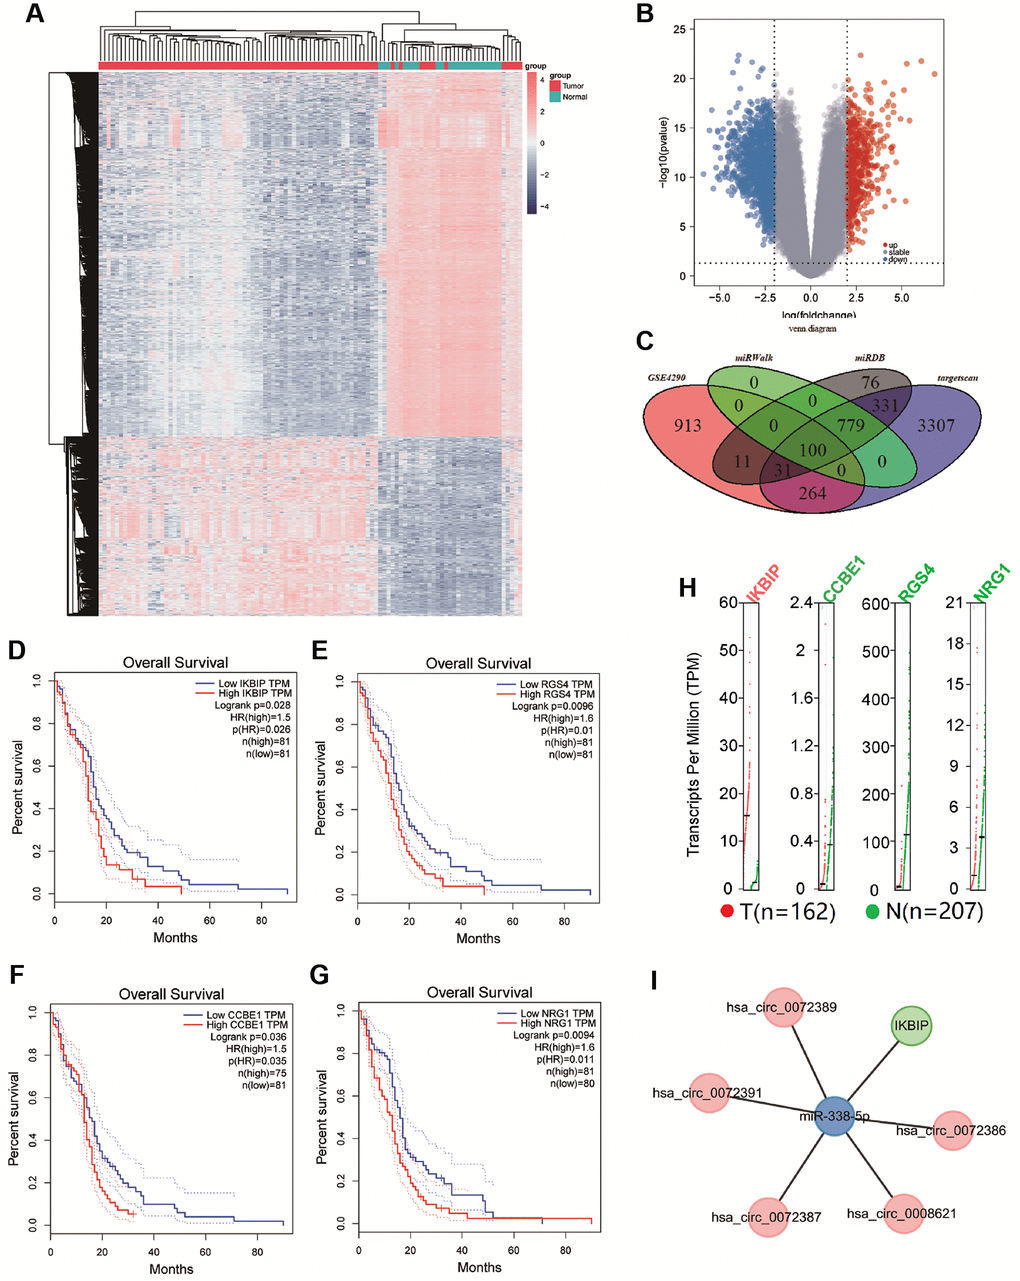
Figure 3.(A and B) Cluster analysis and volcano map demonstrate differential mRNAs in gliomas of GSE4290. (C) The Venn diagram shows the intersection of differential genes between GSE4290, miRwalk database, miRDB database, and targetscan database. (D–G) Survival curve shown the correlation between the expression of CCBE1, IKBIP, NRG1, and RGS4 with overall survival time (p < 0.05). (H) Gene Expression Profile of IKBIP, CCBE1, NRG1, and RGS4, red dots indicated the expression of tumor tissue, green dots indicated the expression of normal tissue. (I) Network of hsa_circ_0072389, hsa_circ_0072386, hsa_circ_0008621, hsa_circ_0072387, hsa_circ_0072391, miR-338-5p, and IKBIP.