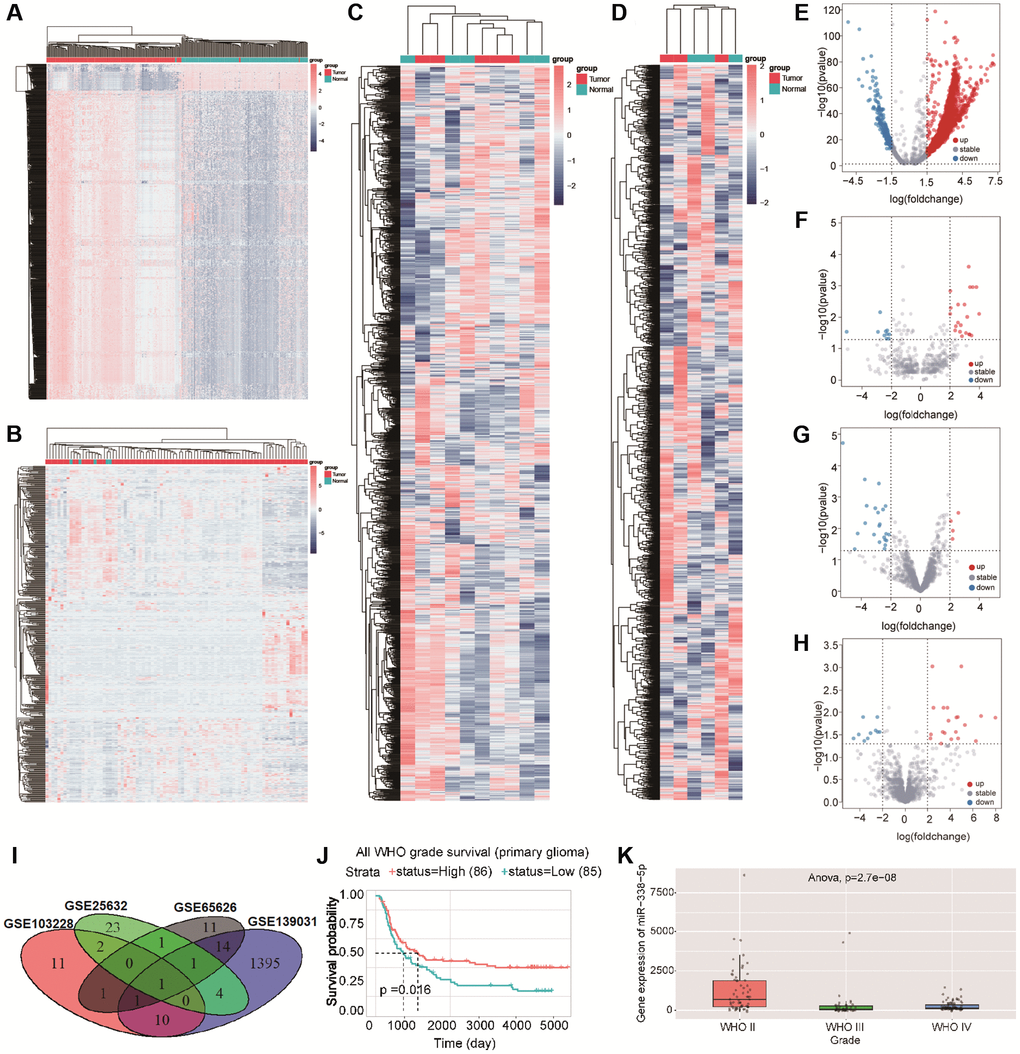
Figure 1.(A–D) Cluster analysis showed the differential genes in GSE139031, GSE25632, GSE103228, and GSE65626 in turn .red dots indicated upregulated differential genes and blue dots indicated downregulated differential genes. (E–H) volcano map showed the differential genes in GSE139031, GSE25632, GSE103228, and GSE65626, Red dots represent differential genes with logFC ≥ 2, p < 0.05, blue dots represent differential genes with logFC ≤ 2, p < 0.05. (I)The Venn diagram shows the intersection of differential genes between GSE139031, GSE25632, GSE103228, and GSE65626. (J) Survival analysis demonstrated the effect of miR-338-5p on glioma. (K) The box diagram showed that the expression level of miR-338-5p in WHO II was significantly higher than that in WHO III and WHO IV.