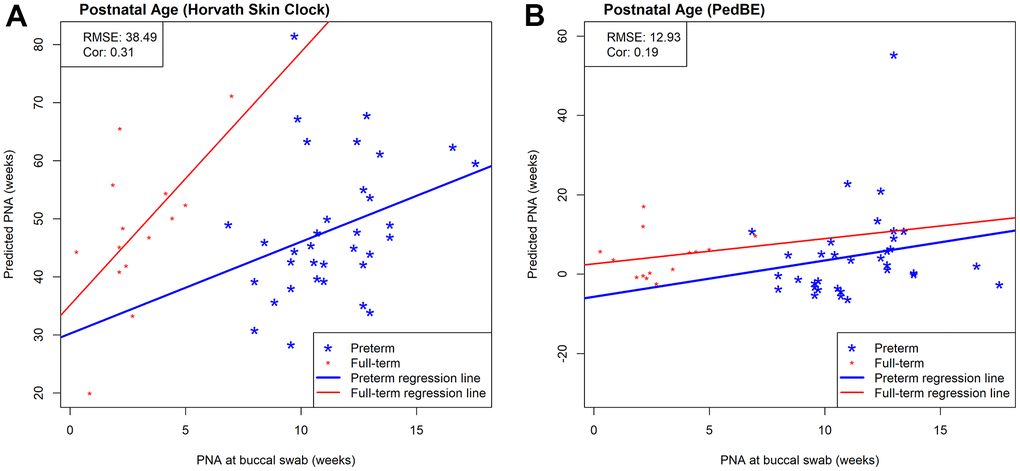
Figure 6.Scatterplots of measured PNA and PNA estimates by (A) Horvath’s skin-blood clock and (B) PedBE in an external saliva data set (GSE72120 [18]). This saliva data set was measured by the 450k array and included full-term (red) and preterm (blue) infants. The reported prediction performances, RMSE and correlation coefficients, between estimated and measured age metrics are based on preterm infants only.