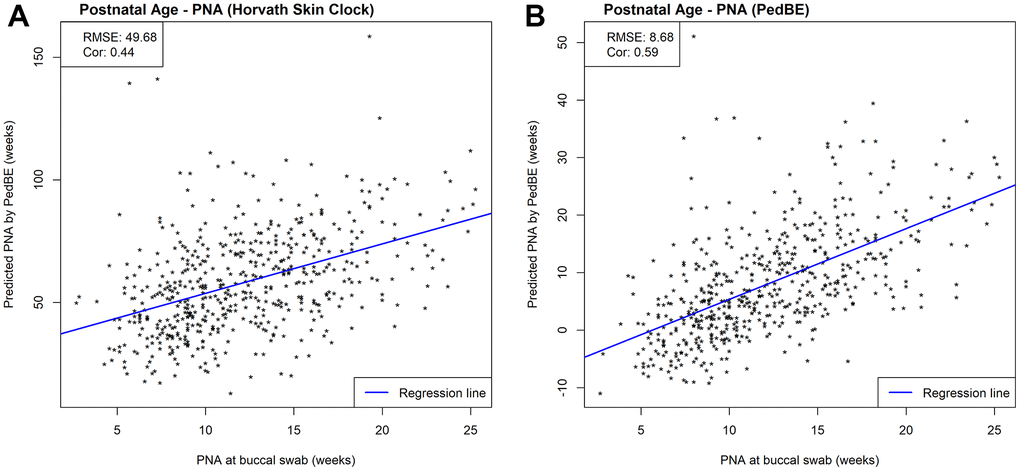
Figure 5.Scatterplots of PNA estimated by (A) Horvath’s skin-blood clock and (B) PedBE and measured PNA within NOVI. Prediction performances are evaluated by RMSE and correlations between estimated and measured PNA.
Figure 5 — NEOage clocks - epigenetic clocks to estimate post-menstrual and postnatal age in preterm infants | Aging