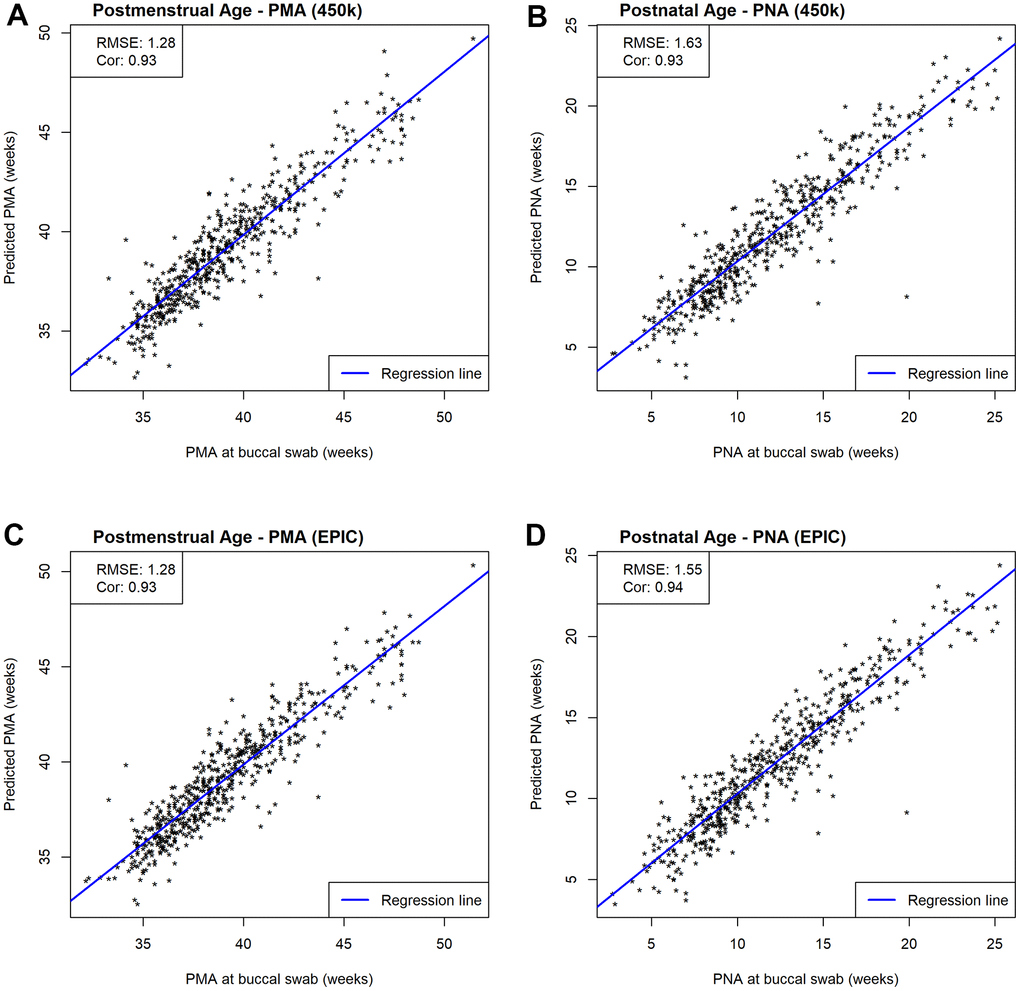
Figure 3.Scatterplots of estimated and measured age. Prediction performances are evaluated by RMSE and correlations between estimated and measured age metrics. (A) Scatterplots of estimated and measured PMA using our 450k NEOage clocks within NOVI. (B) Scatterplots of estimated and measured PNA using our 450k NEOage clocks within NOVI. (C) Scatterplots of estimated and measured PMA using our EPIC NEOage clocks within NOVI. (D) Scatterplots of estimated and measured PNA using our EPIC NEOage clocks within NOVI.