Submit an Article
Navigate
Home
Editorial Board
Editorial Policies
Current Volume
Archive
Scientific Integrity
Publication Ethics Statements
Interviews with Outstanding Authors
Newsroom
Sponsored Conferences
Podcast
Contact
Special Collections
Submit an Article
Online ISSN: 1945-4589
Research Paper
|
Volume 13, Issue 18
|
pp. 21941–21961
Synergic association of diabetes mellitus and chronic kidney disease with muscle loss and cachexia: results of a 16-year longitudinal follow-up of a community-based prospective cohort study
Back to article
Figure 3
(3 of 3)
−
100%
+
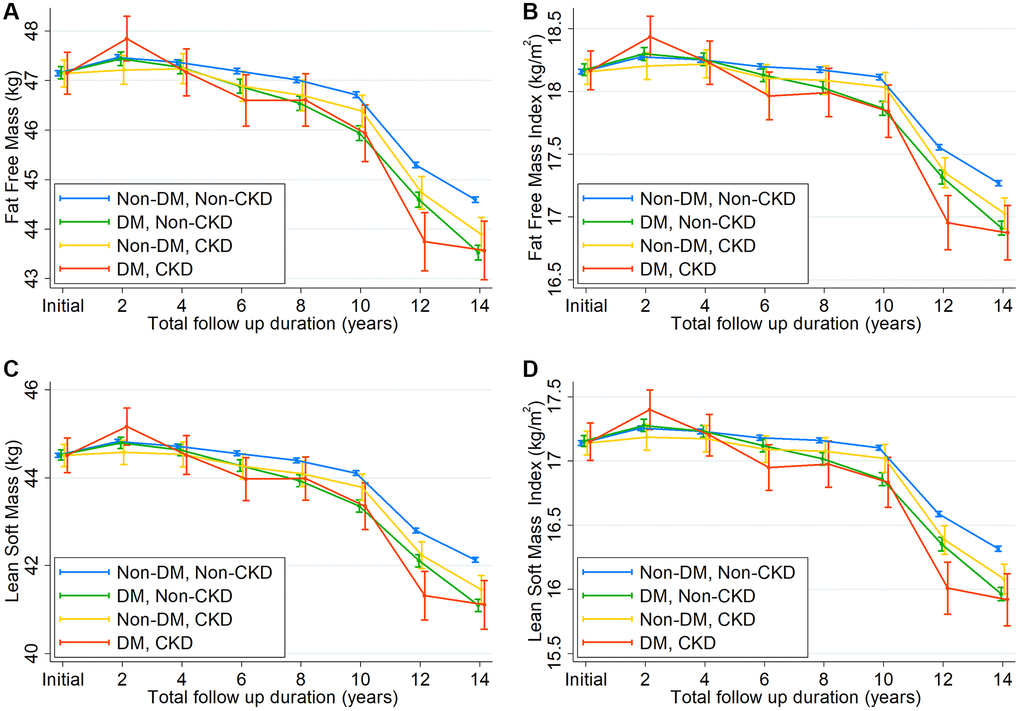
Figure 3.
Changes in (
A
) fat-free mass, (
B
) fat-free mass index, (
C
) lean soft mass, and (
D
) lean soft mass index over time according to 4 groups by diabetes mellitus and chronic kidney disease.