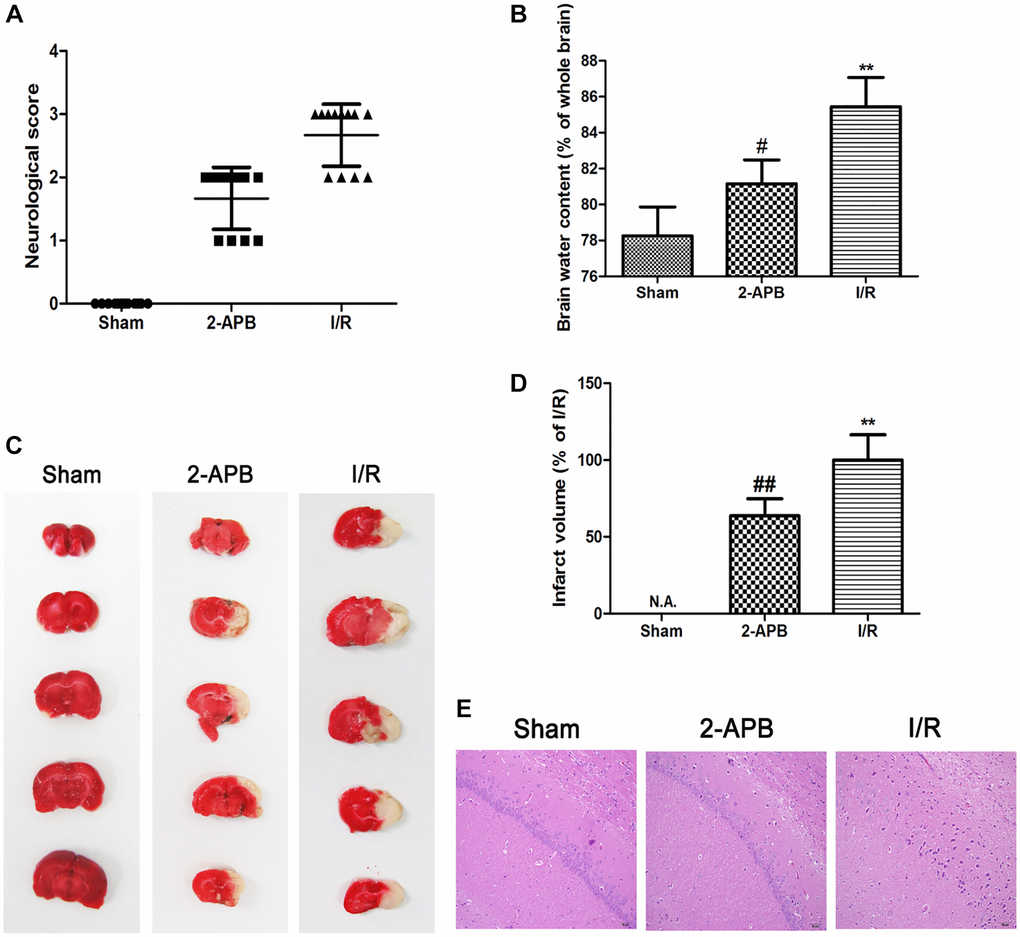
Figure 6.2-APB decreased neuronal damage after I/R injury. (A) Neurologic scores were evaluated at 72 h after reperfusion (n = 12). (B) Brain edema was examined at 72 h after reperfusion. Data are expressed as means ± SD (n = 6). (C–D) The infarct area was observed by TTC staining. The infarct size was shown as the ratio of corrected infarct area to whole brain area. Data are expressed as means ± SD (n = 6). **p < 0.01 vs. Sham, ##p < 0.01 vs. I/R. (E) The brain sections of rats were stained with H&E staining (magnification, ×200).