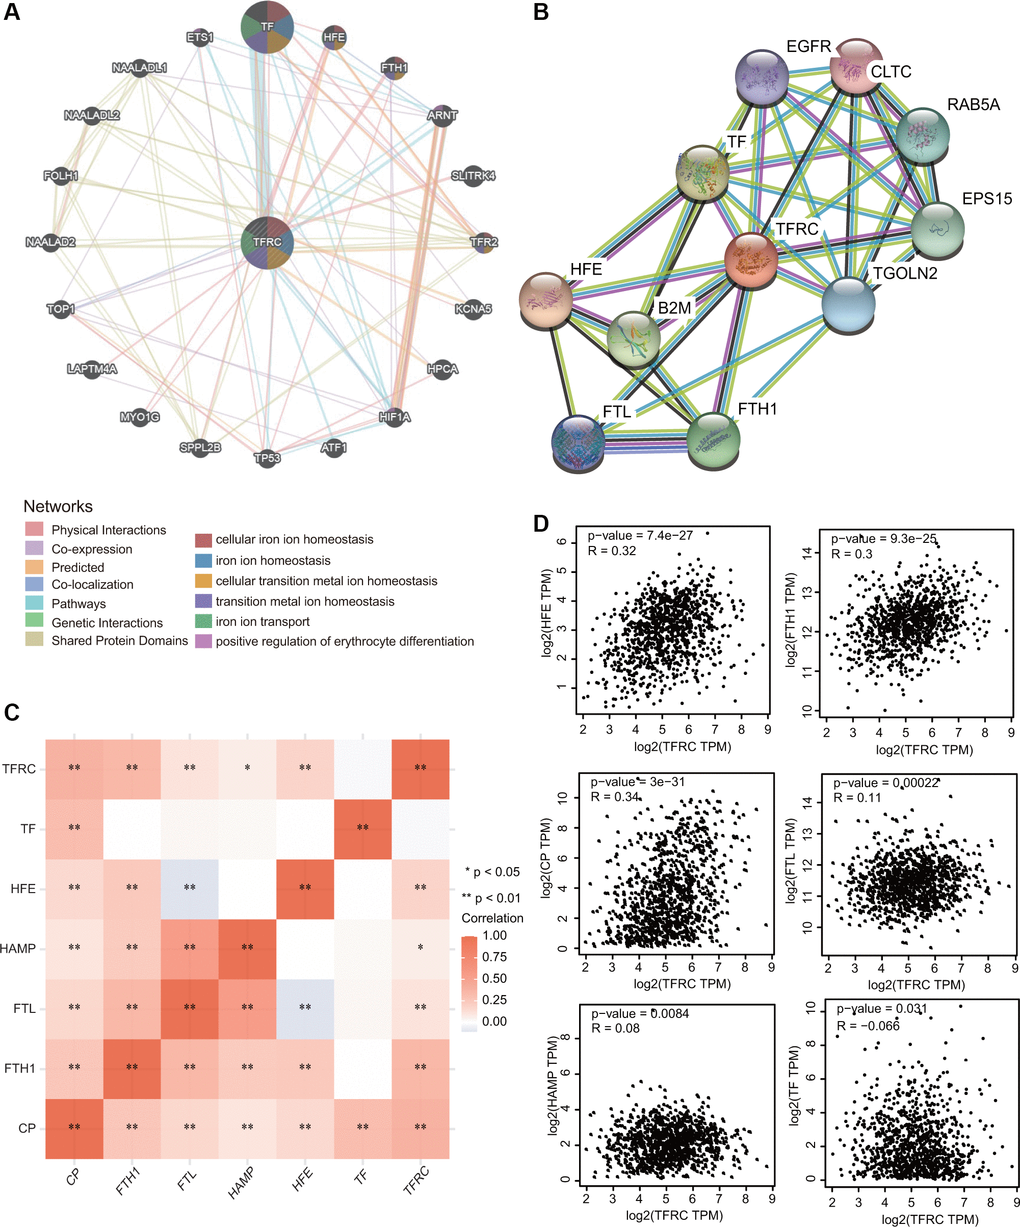
Figure 8.Interaction network of TfR1 in BC. (A, B) The gene-gene interaction and PPI network of TfR1 were constructed using GeneMANIA and STRING, respectively. (C) The heat map showing the correlations of TfR1 and various iron-related genes. (D) Scatterplots showing the correlations of TfR1 expression and HFE, FTH1, CP, FTL, HAMP and TF in BC through GEPIA database. *< 0.05, **< 0.01.