Submit an Article
Navigate
Home
Editorial Board
Editorial Policies
Current Volume
Archive
Scientific Integrity
Publication Ethics Statements
Interviews with Outstanding Authors
Newsroom
Sponsored Conferences
Podcast
Contact
Special Collections
Submit an Article
Online ISSN: 1945-4589
Research Paper
|
Volume 13, Issue 17
|
pp. 21671–21699
Integrated analysis identifies TfR1 as a prognostic biomarker which correlates with immune infiltration in breast cancer
Back to article
Figure 12
(12 of 12)
−
100%
+
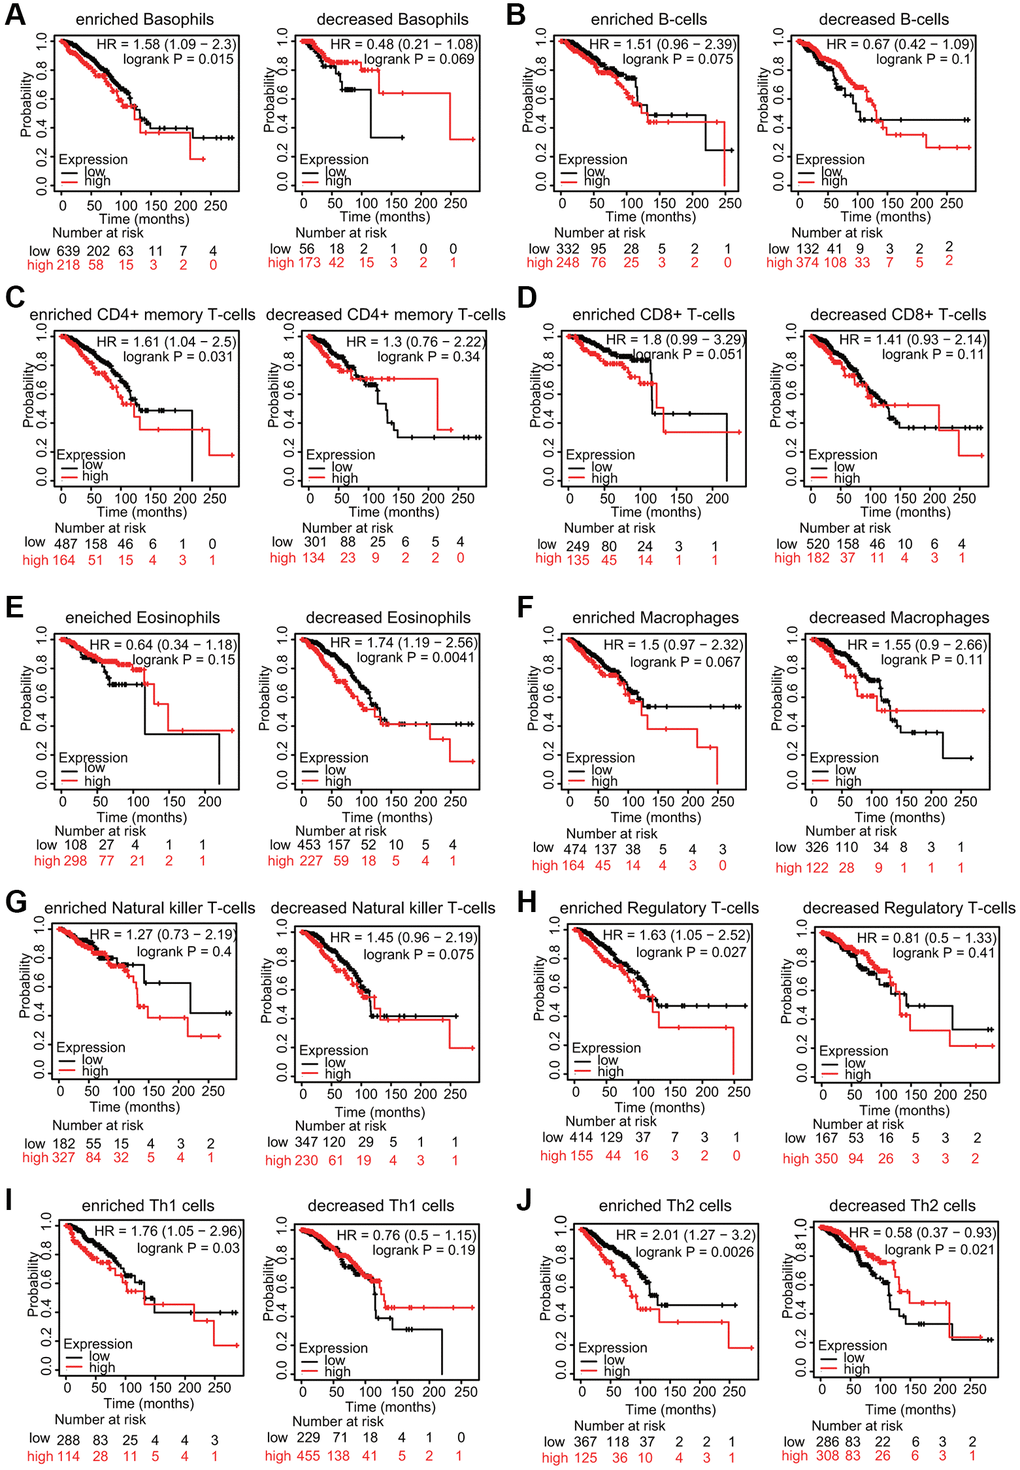
Figure 12.
KM survival curves based on different expression levels of TfR1 in various subgroups of BC patients.
(
A
–
J
) The relationship between TfR1 expression and the OS rate in diverse immune cell subgroups of BC patients was explored.