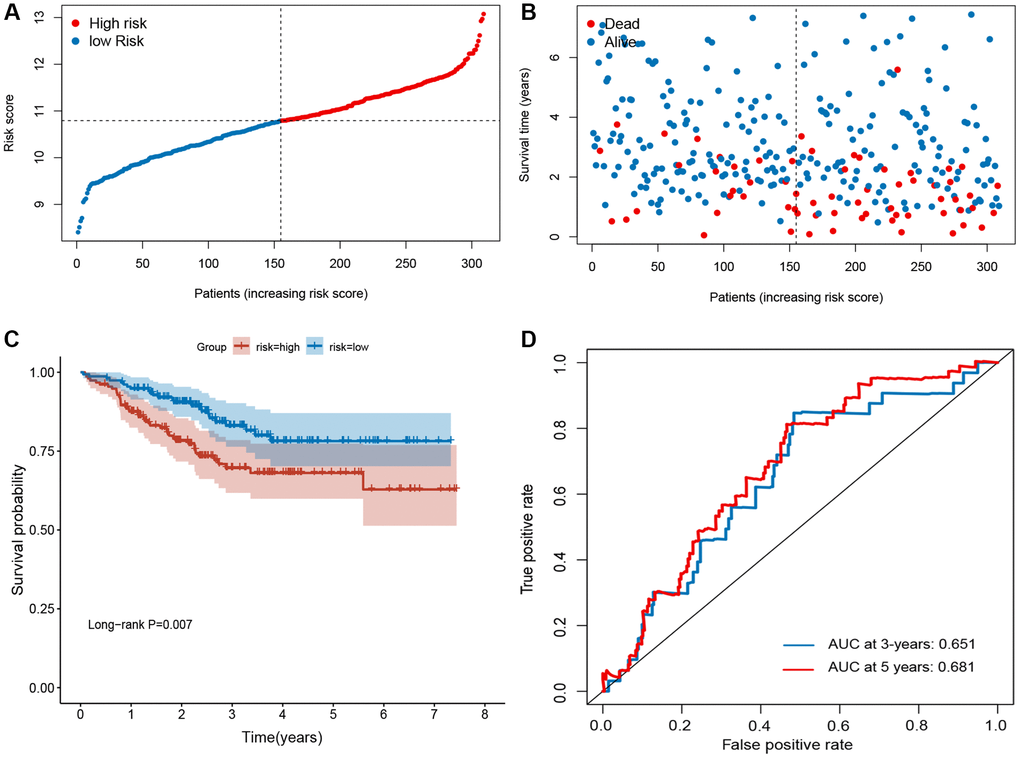
Figure 4.Evaluation of ferroptosis-related gene signature in GSE25066 dataset. (A) The ranked dot plot indicates the risk score distribution. (B) Scatter plot illustrates the patients’ survival status. (C) Kaplan-Meier method was used to plot the RFS curve for the high-risk score and low-risk score groups. (D) ROC curve of 10-FRG signature.