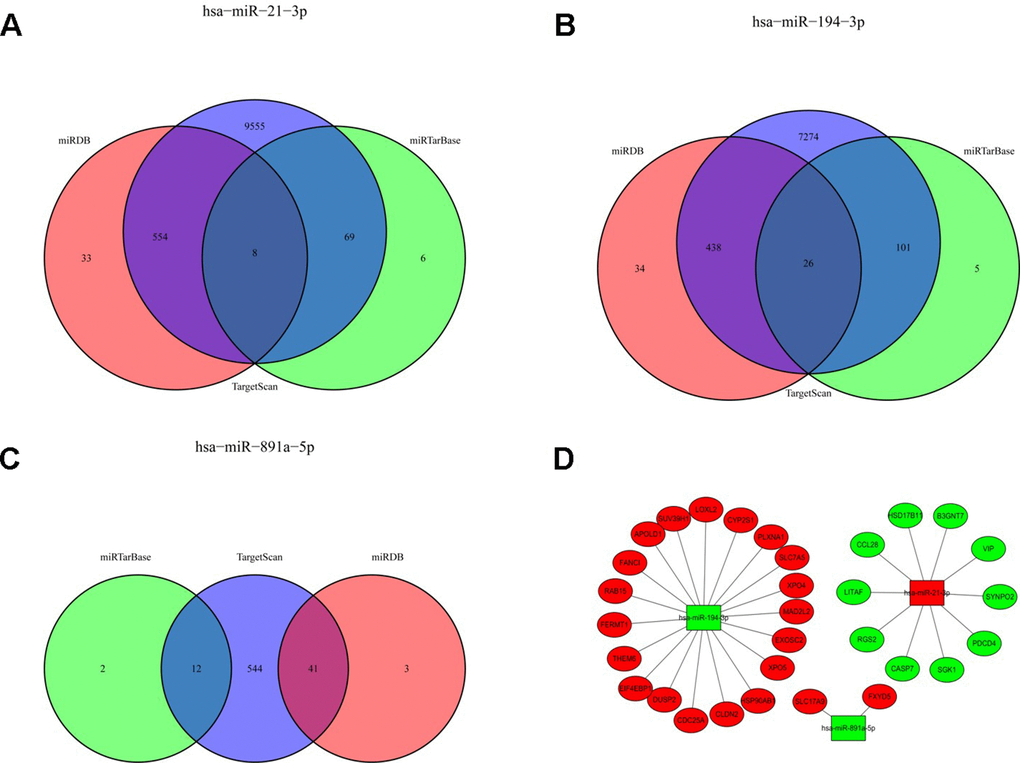
Figure 7.The Venn diagram of the sDMIRs TGs and the regulatory networks of sDMIRs. The predicted TGs were screened from miRDB, TargetScan, and miRTarBase databases. The overlaps meant the numbers of TGs predicted by more than one database. ((A) hsa-miR-21-3p; (B) hsa-miR-194-3p; (C) hsa-miR-891a-5p). The regulatory networks of sDMIRs and TGs (D); green parts represent down-regulation and red parts represent up-regulation.