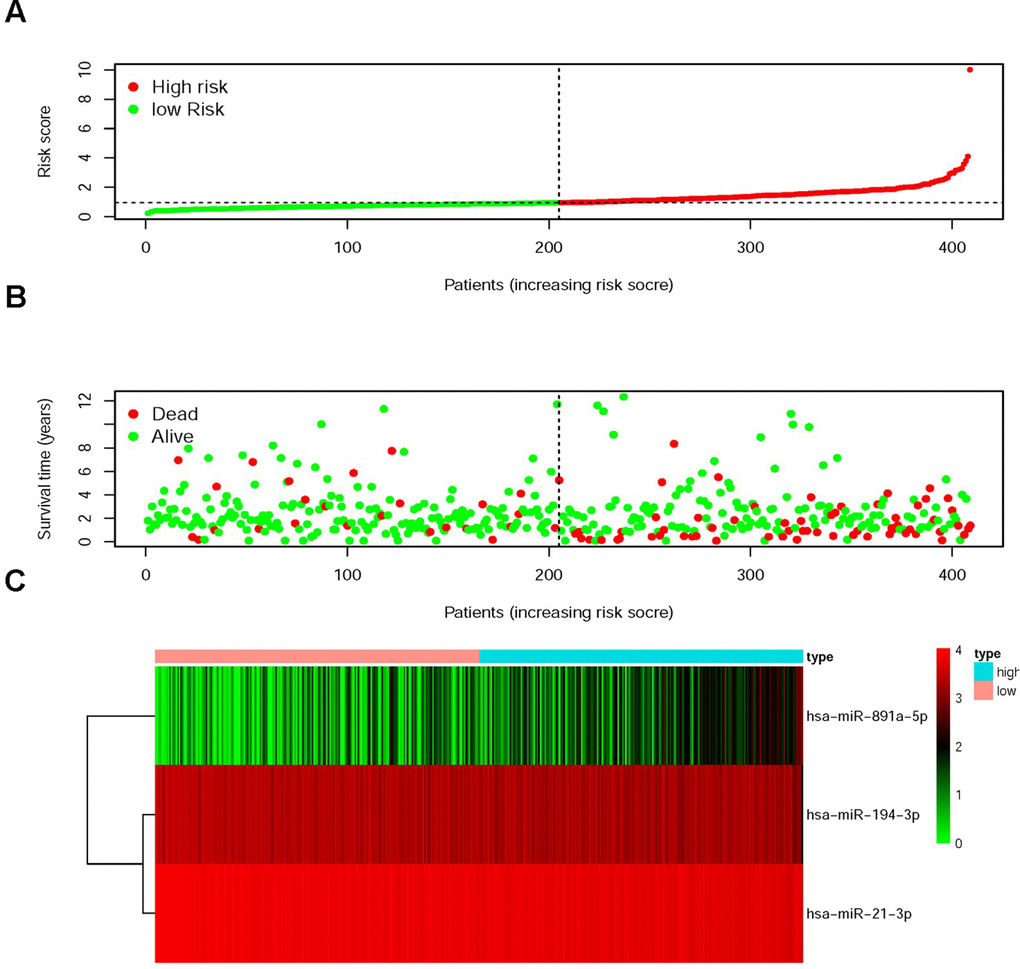
Figure 3.Risk score model (RSM) was established based on sDMIRs. The distribution of risk score in the high-risk group and the low-risk group (A). Survival status in the low-risk group and the high-risk group (B). The heatmap of the expression levels of sDMIRs (hsa-miR-194-3p, hsa-miR-21-3p and hsa-miR-891a-5p) contained in the RSM (C) based on TCGA database.