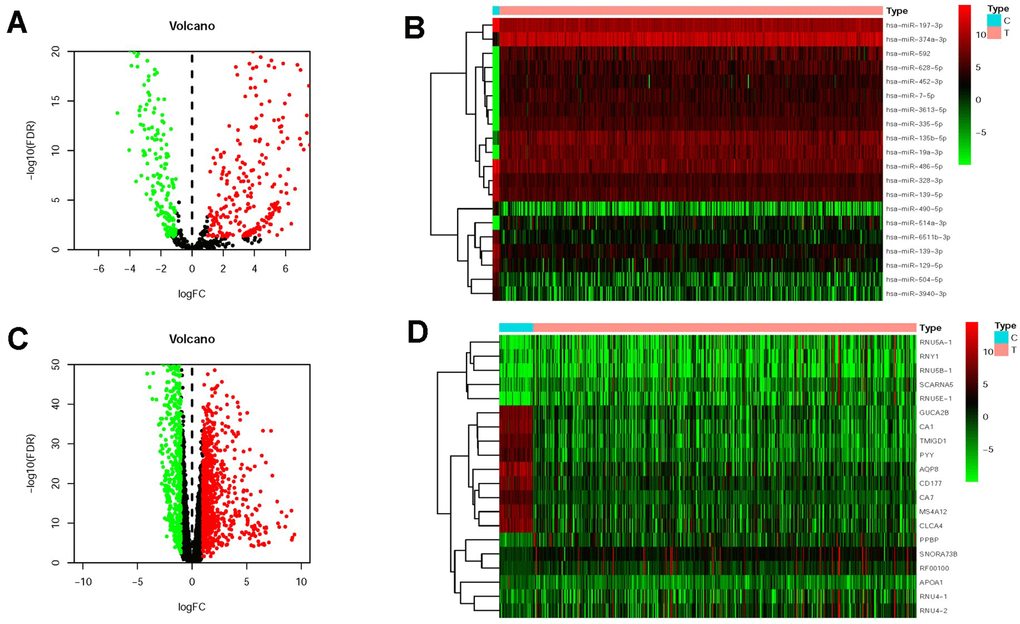
Figure 1.Differentially expressed miRNAs and mRNAs in CRC. The differentially expressed miRNAs (DMIRs) in CRC and adjacent non-tumor tissues were showed in the volcano plot (A) and heatmap (B) based on TCGA database. Volcano plot (C) and heatmap (D) demonstrated the differentially expressed mRNAs between CRC tissues and adjacent normal tissues based on TCGA database. The red parts represented the upregulated genes; the green parts represented the downregulated genes, and the black parts represented the genes without significant difference. FDR < 0.05, log2 | FC | >1 and P < 0.05.