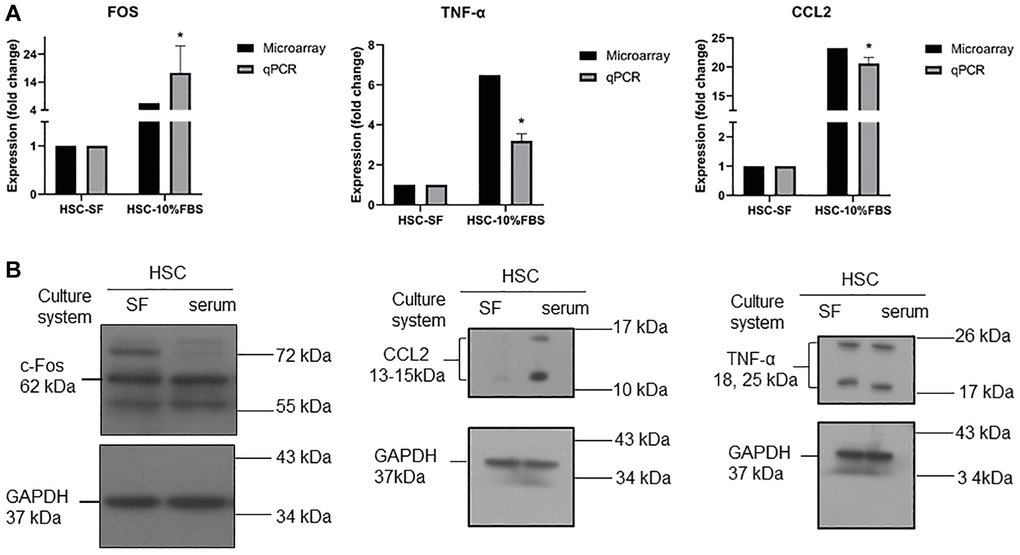
Figure 5.(A) RT-qPCR analysis for mRNA expression of CCL2, TNFα, and FOS in serum and serum-free cultured hematopoietic stem cells. Quantification of gene expression normalized with respect to GAPDH. (n = 3, data are expressed as means ± SD. *p < 0.05 versus serum free condition). (B) Western blot analysis for protein expression of CCL2, TNFα, and FOS in serum and serum-free cultured hematopoietic stem cells. GADPH was used as a loading control.