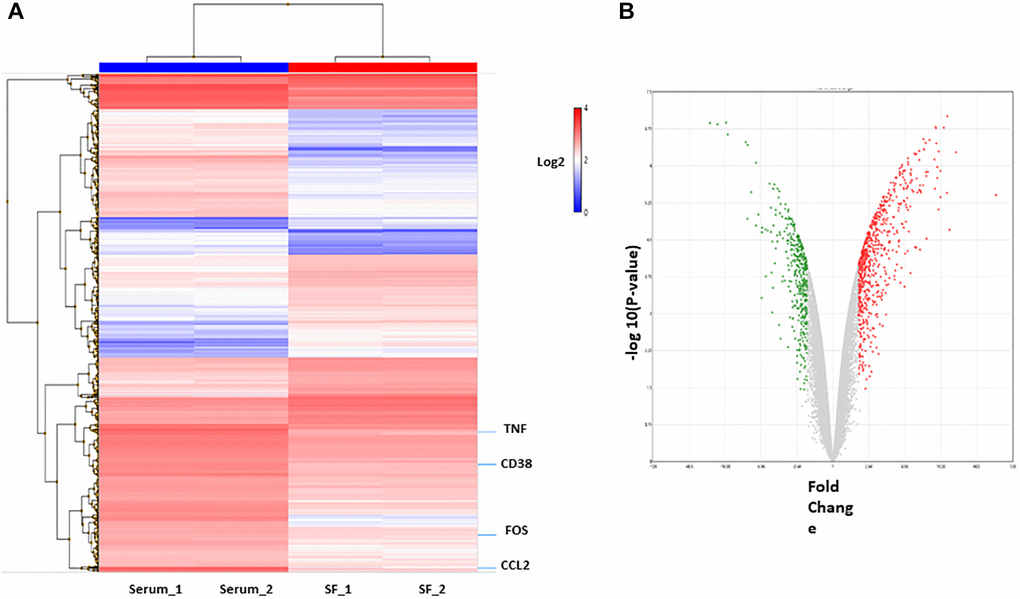
Figure 3.Differentially expressed genes in culture system with or without serum. (A) Hierarchical cluster showing the genes differentially expressed between the two groups. Significant genes (fold change of 2.0 and p < 0.05.) are shown in the heatmap. (B) The volcano plot shows 839 genes differentially expressed (578 genes upregulated (red) and 261 downregulated (green) in serum condition).