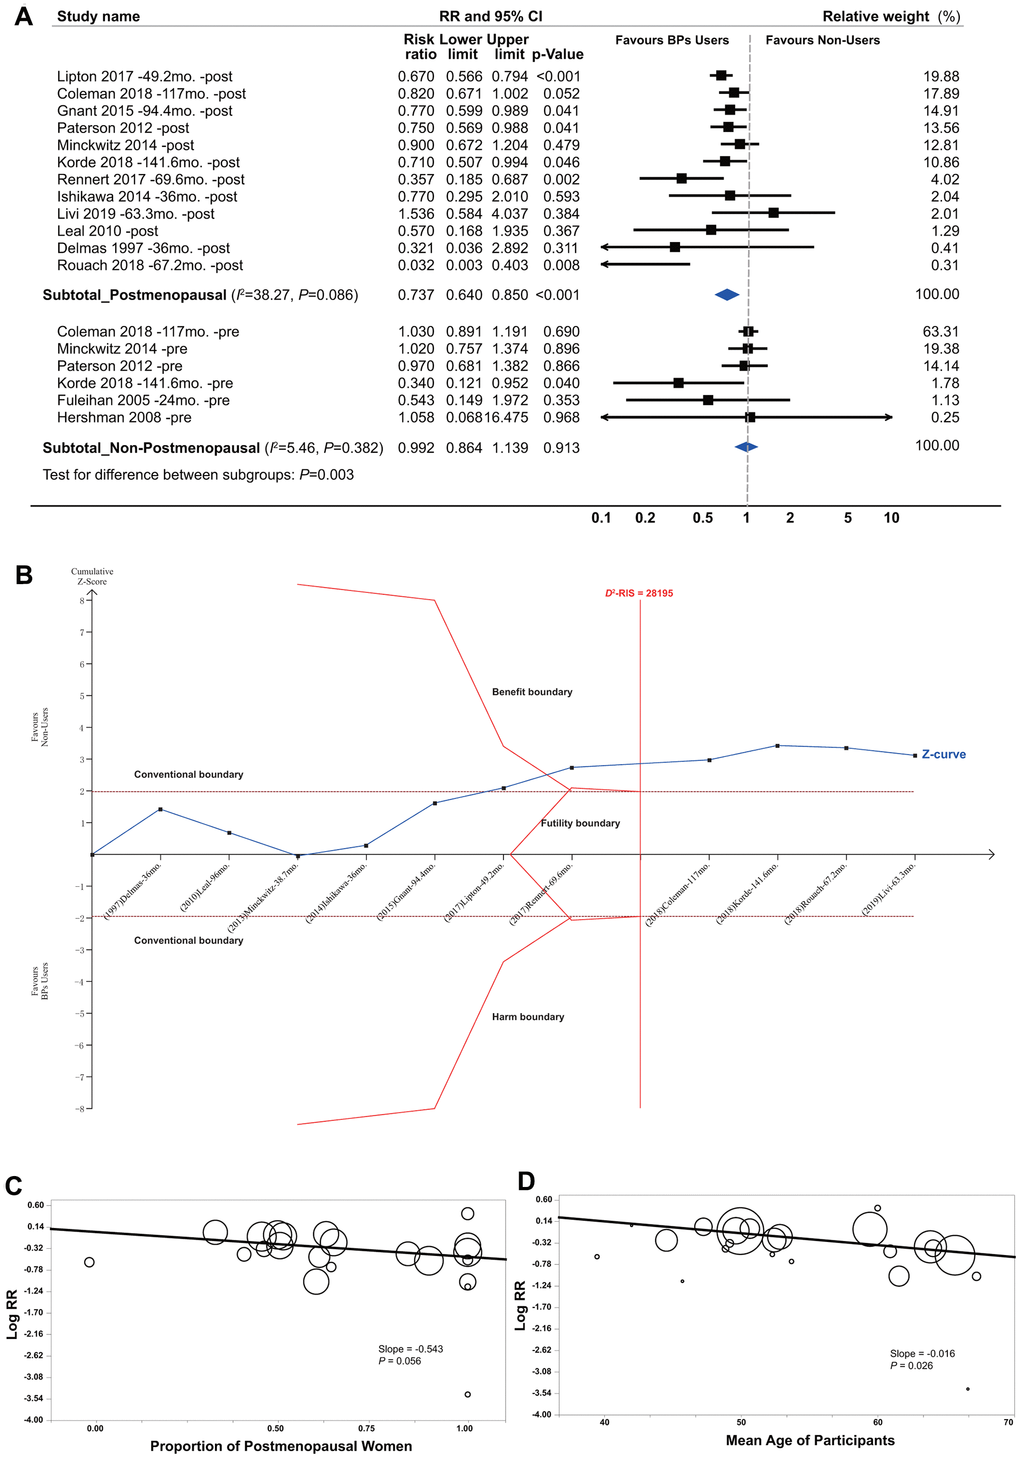
Figure 5.Summarized results of bisphosphonates and breast cancer survival by menopause status. (A) Conventional subgroup meta-analysis by menopause status; (B) Trial sequential analysis of the postmenopausal subgroup; (C) Meta-regression analysis based on the proportion of postmenopausal women and (D) the mean age of participants in individual studies. In the panels of (C, D) circles indicate individual studies, and the size of the circle is proportional to the relative weight that the study has in calculating the summary effect estimate.