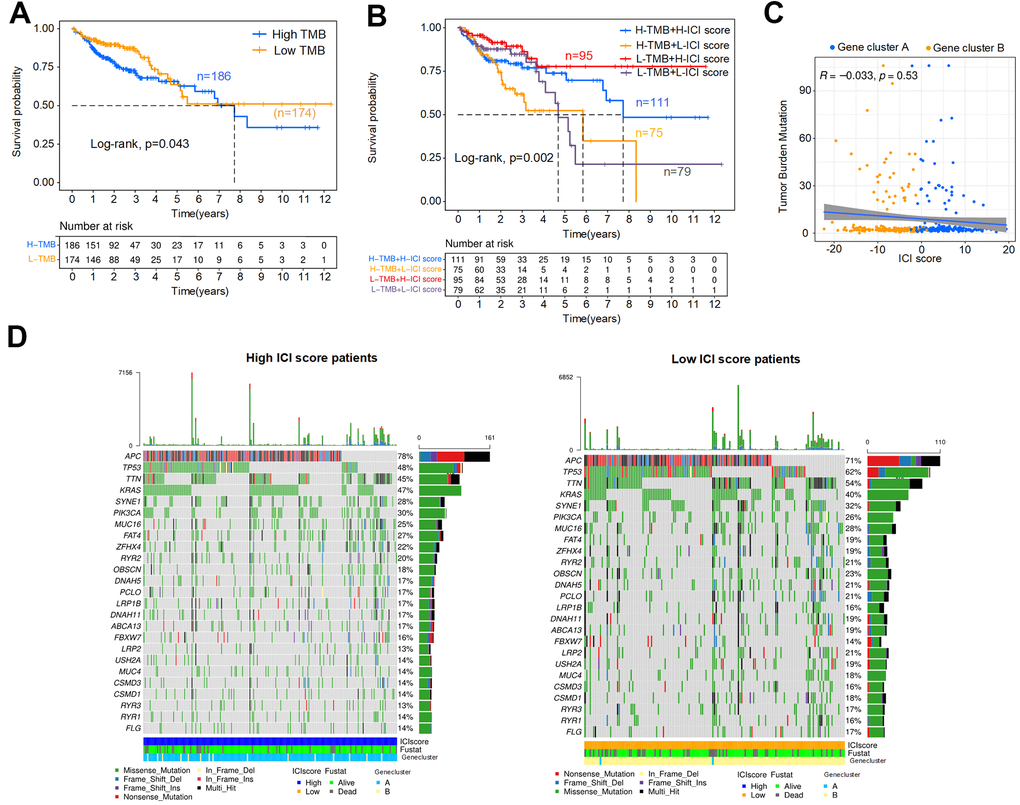
Figure 7.Association analysis of the ICI score and TMB. (A) Kaplan-Meier curve for high and low TMB colon cancer patients (Log-rank test, p=0.043). (B) Kaplan-Meier curve for combined subgroups of the ICI score and TMB (Log-rank test, p=0.002). (C) Correlation analysis between the TMB and ICI score, Spearman correlation coefficient = -0.033, p=0.53. (D) Waterfalls plot of driver gene mutations in the high and low ICI score subtypes. Rows represent colon cancer samples with different subgroups, columns represent genes, and the mutation type is indicated by different colors.