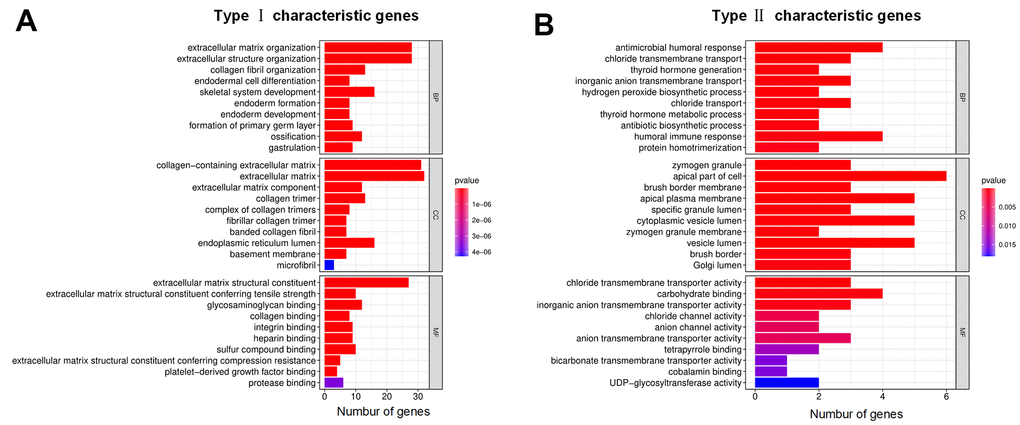
Figure 5.GO annotations for characteristic DEGs. (A) Bar chart for type I characteristic genes. (B) Bar chart for type II characteristic genes. The abscissa represents the number of characteristic genes, and the ordinate shows the GO term. BP represents biological process, CC represents cell component, and MF represents molecular function.