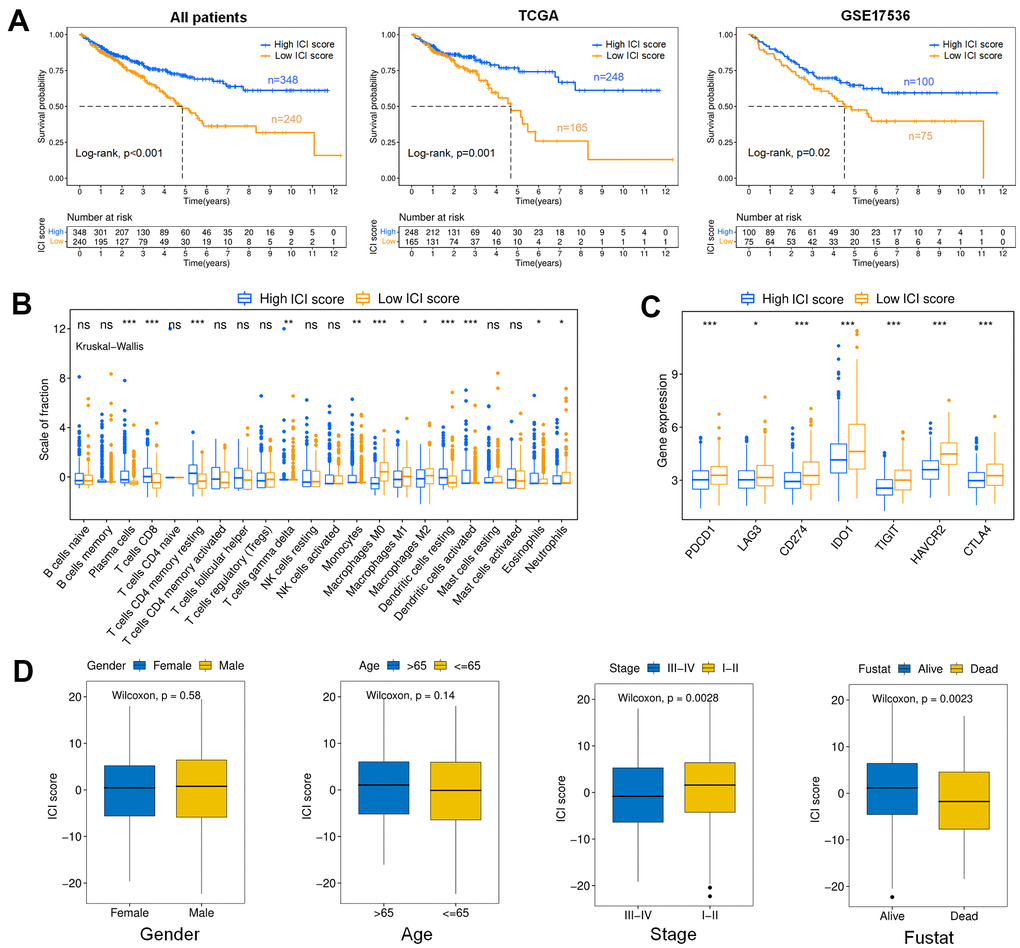
Figure 4.Analysis of the ICI score. (A) Kaplan-Meier curves for colon cancer patients with high and low ICI scores (Log-rank test). All patients (p<0.001); TCGA (p=0.001); GSE17536 (p=0.02). (B) Boxplot showing the contents of tumor-infiltrating immune cells within the high and low ICI score subgroup (Kruskal-Wallis test, ***p< 0.001, **p<0.01, *p<0.05). (C) immune checkpoint gene expression analysis for colon cancer in high and low ICI score subgroups. (Kruskal-Wallis test, ***p<0.001, **p<0.01, *p<0.05). (D) Boxplots showing the difference of ICI scores with different Clinical characteristics (Wilcoxon test). Gender (p=0.58); Age (p=0.14); Stage (p=0.0028); Fustat (p=0.0023).